Design and Performance Analysis of 3-D MEMS Acoustic Emission Sensor
Citation:XIA Chengyang (2019) Design and Performance Analysis of 3-D MEMS Acoustic Emission Sensor.J Mater sci Appl 3: 1-8.
Acoustic emission (AE) technology is widely used in non-destructive testing to determine the origin of the damage, damage evolution process, and final failure by receiving and analyzing the acoustic emission signals of materials. So far, AE technology has been successfully applied to monitor a variety of different structures, such as highway bridges, pipelines, composites, etc [1-3].
At present, most of the micro AE sensors developed are single-axis sensors that respond only to the normal direction displacement (z-direction displacement) of the structural surface mounted with sensors. Domestic research on 3-D MEMS acoustic emission sensors is almost a blank, and there are individual groups in foreign countries conducting research on 3-D MEMS sensing. In 2005 Ozevin et al [4] developed a capacitive resonant MEMS AE sensor spanning the frequency range of 100-500 kHz. Experiments show that the sensitivity of MEMS sensors (8.8×10⁷(V/m)) is about 50 times higher than that of the traditional piezoelectric AE sensor at atmospheric pressure. In 2012, Auerswald et al [5] designed a comb-like driving AE sensor using the principle of capacitance change, but the sensor sensitivity is poor. In the studies on acoustic emission sensors, the resonant capacitance sensors studied by most scholars have low Q and sensitivity (for example, for the traditional perforated plate, Q = 2 when frequency f =182kHz).
In this study, in order to accurately detect the position and extension direction of engineering material cracks, and get a kind of simpler structure, lower cost, smaller size and higher sensitivity of the acoustic emission sensor, this paper proposes a novel MEMS 3-d acoustic emission sensor, analyzes the mechanism of the 3-D sensing unit, establishes the model of the sensor, and numerically calculates its damping and sensitivity. The sensor's quality factor Q and sensitivity are improved. Finally, the simulation simulates sensing. The resonant frequency and deformation of the unit verify the feasibility of the 3-D acoustic emission sensor.
Each sensor unit of the MEMS acoustic emission sensor is a resonant capacitor. The simplified model is shown in Figure 1, in which the lower plate is fixed and the upper plate is suspended by a spring. Within the frequency response range of the sensor, when the material is fractured and the frequency of sound wave generated by the crack is the same or close to the natural frequency of the sensor, the gap between the two electrodes vibrating in the Z direction will cause the change of capacitance, and thus generate a changing electrical signal. The acoustic emission signal frequency of the composite material is generally between 100kHz~1MHz [6] and can generate transient complex signals. Due to the rapid attenuation characteristics of higher frequency [7], the resonant frequency of the designed sensor in this paper is controlled within 100 kHz ~500kHz.
The distance between the upper and lower plates of the sensing unit of this study is 1.25μm. At this time, the damping generated by the air compression between the plates is not negligible, so the size of the squeeze film damping affects the sensitivity of the sensor.
The damping ratio of the squeeze film damping is calculated as equation (1):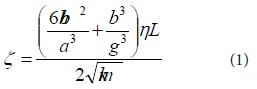
Where a is the thickness of the plate, hand b are the width and length of the etched hole, g is the gap between the plates, η is the viscosity of the air, L is the length of the beam, k is the stiffness coefficient, and m is the mass of the plate , ζ is the damping ratio.
The damping force of a single sensing unit can be calculated using the Reynolds fluid equation. The study has shown that [8], when the frequency of the circular plate resonant sensing unit is lower than 1MHz, the gas is regarded as incompressible, and considering the symmetry of the circular plate in the Z direction, the governing equation of the gap gas can be expressed by the Reynolds equation, as shown in equation (2):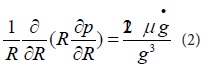
Where R is the radius of the circular plate, P is the pressure of the air between the plates, and g is the gap between the plates.
For the circular plate with a radius of R, it is vibrated up and down along the Z direction in a completely open environment [9], and the boundary conditions are established. The expression of the damping force is finally obtained as in equation (3):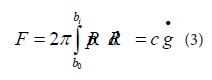
In the equation, F is the damping force acting in the Z direction, b0 and b1 are the boundaries of the circular plate, and g is the gap between the plates.
The sensitivity of the sensing unit is the ratio of the dynamic surface displacement u(t) to the sensor output voltage Vout(t), so it is necessary to calculate the surface displacement amount and the output voltage value of the sensing unit. By simplifying the out-of-plane sensing unit to a single-degree-of-freedom system (SDOF), the calculation process can be simplified, as shown in Figure 2. The upper plate is simplified as a mass block, which is suspended by the spring and generates variable capacitance by applying voltage, thus causing the change of output voltage.
Assume that u(t) is in the form of equation (4):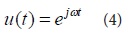
The equation of motion of the SDOF system is established as equation (5):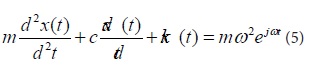
The quality factor Q [10] associated with the damping effect of the squeeze film in the single-degree-of-freedom system is expressed in equation (6):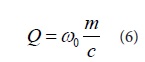
Substitute equation (6) into equation (5) to obtain equation (7) :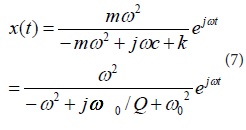
Where the relationship between x(t) and Vout(t) in equation (8):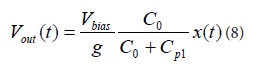
Substituting equation (7) into equation (8), the output voltage is equation (9):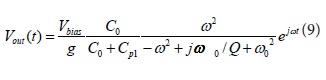
Where x(t) represents the relative displacement of the capacitive layer, m is the mass of the plate on the sensing unit, k is the spring stiffness, c is the damping constant, t is the time, ω is the resonant frequency of the sensing unit, 0ωis The frequency of the sound wave, 0Cis the capacitance value of the sensing unit, 1pCis the parasitic capacitance of the sensing unit,)(tVoutis the output voltage, andbiasV is the bias voltage.
If the natural frequency and the acoustic frequency of the sensing unit are equal, that is0ωω=, it can be obtained as equation (10):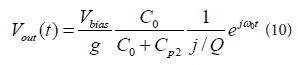
Then, the sensitivity of the sensing unit can be calculated by equation (11):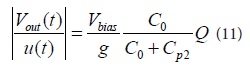
Using the above formula, the theoretical calculation of the out-of-plane sensing unit of this study is carried out, and the main performance parameters of the sensing unit are shown in Table 1.
In this study, figure 3 shows the structure diagram of the out-of-plane sensor unit. The out-of-plane sensing unit is fixed to the upper substrate by 1, 2 anchors, and the springs 3, 4 support the substrate, and by changing the gap between the upper and lower plates, the capacitance value gives the output voltage change.
In the ideal state, regardless of the rotation of the circular plate, the calculation formula of the capacitance of the out-of-plane sensing unit [4] is given by equation (12):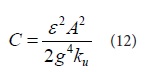
Where k is the relative dielectric constant, A is the plate area on the sensing unit, Ku is the translational stiffness of the plate on the sensing unit, and g is the gap between the plates.
Assuming that the node connected by the spring element to the upper plate (node c in Figure 3) does not rotate, the deflection displacement equation of node c in the z-direction is given by equation (13):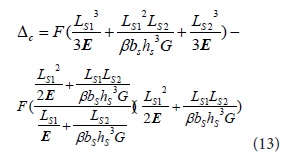
Where F is the force applied at point c, E is the tensile elastic modulus, G is the shear modulus, I is the moment of inertia, LS1,LS2 is the length of the spring, and bS hS are the length and width of the spring section, β is a coefficient related to the aspect ratio of the section (bS/hS) (when the aspect ratio bS/hS> 10, known as the long and narrow rectangle, and β can approximate to 1/3).
When F=1, the translational stiffness kc of the spring element is the reciprocal of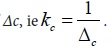
The out-of-plane sensing unit is shown in Figure 3. One sensing unit is supported by four springs, and the translational stiffness Ku of the sensing unit is obtained by equation (14):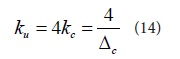
According to the above formula, the values of the springs Ls1 and Ls2 can be obtained, and the length of Ls1 is 46 μm, and the calculated Ls2 is 54.7 μm.
Yang Fan's research southeast University showed that [9], the larger the perforation ratio (h/p), the smaller the damping of the extruded film of the circular plate. In order to minimize the influence of the damping of the extruded film and obtain a design capacitance of 40pF, the grid hole length is designed to be 15μm and the width is 5μm. The perforation ratio in the x-direction is 0.75, and the perforation ratio in the y-direction is 0.33. The specific geometric parameters are shown in Table 2.
Figure 4 shows the CAD layout of a 4 mm x 4 mm MEMS acoustic emission sensor chip. Each sensor contains 64 sensing units in an 8 x 8 array, connecting each sensing unit to the pad, leading to two leads. Foot for easy ceramic packaging.
The out-of-plane sensing unit analyzed had a diameter of 100μm and a plate thickness of 2 μm. The meshing is automatically divided, and the localization is refined. The minimum value of the obtained mesh unit is 2×10⁻³mm. The material of the sensing unit is polysilicon (PolySi), and Table 3 is the material parameter of polysilicon.
In the undamped state, as shown in the first-order vibration mode shown in Figure.5, the natural frequency of the out-of-plane sensing unit is 104.87 kHz, and the designed natural frequency of the ideal sensing unit is 100 kHz, and the relative deviation is 4.87%.
In the damped state, the damping ratio is set to 3.68×10⁻³, the stiffness damping is 1.171×10⁻³, and the damped state is obtained as shown in Figure.6. According to the analysis results of ANSYS, in the undamped state, the deformation of the circular plate decreases from the center to the edge; in the damped state, the amount of edge deformation is large.
In this study, the excitation source uses the simple harmonic as the input analog, the minimum input frequency is set to 50 kHz, the maximum frequency is set to 150 kHz, the damping ratio is 3.68×10⁻³, and the damping force F is 4.75×10⁻⁵N.
The distribution cloud diagram of the damped harmonic response displacement of the out-of-plane sensing unit is shown in Figure.7. The maximum deformation value of the sensing unit under the state of natural frequency is 0.815μm, and the deviation is 1.875% compared with the designed maximum deformation value of 0.8μm. Figure 8 shows the frequency-amplitude curve of the sensing unit at 50kHz~150kHz. It can be seen from the figure that the maximum amplitude is 3.532×10⁻⁸m, and the resonant frequency is 105kHz, which is different from the simulated value of 104.87kHz with a deviation of 0.124%. The deviation between simulation results and theoretical values is less than 5%, which can meet the design requirements.
The in-plane sensing unit designed in this study is divided into two parts, responding in the x-direction and responding in the y-direction. The spring of the in-plane sensing unit adopts two U-shaped springs to replace the cantilever spring support because the U-shaped spring has a smaller mass and is more elastic.
Figure 9 is a structural diagram of the in-plane sensing unit responding in the x-direction. In the in-plane response unit in the x-direction, the sensing unit is fixed by the anchor 1 and the anchor 2, and the U-shaped springs 3 and 4 are connected to the plate a. The plate b and the plate c are connected to the positive and negative voltages respectively and fixed, and the output voltage is changed by changing the gap between the plate and the finger plates on the b and c plates to change the capacitance value.
Figure 10 is a structural diagram of the in-plane sensing unit responding in the y-direction. In the plane responding in the y-direction, the sensing unit is fixed by the anchor 5 and the anchor 6, and the U-shaped springs 7 and 8 are connected to the plate d. The plate e and f are fixed, and the finger pitch of the upper and lower sides is changed by the finger pitch, and the capacitance value is changed to obtain a changed electrical signal.
Figure 11 shows the CAD layout of the finger-type sensing unit for in-plane sensing, including 60 sensing units in the y-direction of the 6 x 10 array and 56 sensing units in the x-direction of the 8 x 7 array. The size of the sensing unit chip is 5mm x 5mm x 1mm.
The in-plane sensing unit analyzed includes two sections that respond in the x-direction and respond in the y-direction. The meshing is automatically divided. The minimum value of the obtained mesh elements is 1×10⁻²mm, and the finite element model of the sensing unit is obtained. The material of the sensing unit is selected as polysilicon (PolySi), and the material parameters of polysilicon are shown in table 3 in section 1.2.
Firstly, a fixed constraint is applied at the anchors 1and 2, and the displacement is applied to the plate a to constrain the degrees of freedom of the sensing unit in the y and z directions, and the first order vibration mode of the sensing unit in the x-direction is obtained, as shown in Figure 12. Secondly, repeating the above operation and apply a given displacement on the plate a to constrain the degree of freedom of the sensing unit in the x and y directions to obtain the first-order vibration mode of the sensing unit in the z direction, as shown in Figure 13.
The resonant frequency of the response of the sensing unit in the x-direction is 470.61kHz, which deviates from the calculated resonant frequency of 460kHz by 2.3%. The response frequency of the sensing unit in the z-direction is 312.59khz, which deviates from the calculated resonance frequency of 300kHz by 4.2%. According to the analysis results, the sensing unit in this study can effectively respond to the acoustic signal in the x-direction and separate the unwanted response frequency in the z-direction.
The first order vibration mode of the sensing unit in the y-direction can be obtained by applying a fixed constraint at the anchor 3 and 4 and applying a positioning displacement on the plate d, and constraining the degrees of freedom of the sensing unit in the x and z directions, as shown in Figure 14. Constrain the degrees of freedom of the sensing unit in the x and y directions is obtained as a first-order vibration mode in the z-direction as shown in Figure 15.
The resonant frequency of the sensing unit responding in the y-direction is 426.95 kHz, and the deviation from the calculated 450 kHz is 5.1%. The resonant frequency of the sensing unit in the z-direction is 301.05 kHz and the deviation from the calculated 300kHz is 0.35%. The analysis results show that the sensing unit of this study (responding in the y-direction) can effectively distinguish the response frequency of the sensing unit in the y-direction and the z-direction.
Through the design calculation and ANSYS analysis of the out-of-plane sensing unit, the following conclusions are obtained:
1) The designed out-of-plane sensing unit adopts a circular plate structure, which can reduce the stress concentration during manufacturing. In the damped state, the maximum deformation is 0.815μm, and the deviation from the calculation result is 1.875%. The deformation range of the circular plate is reasonable ;
2) The upper and lower distances of the grid holes are set to 5μm, and the left and right distance is set to 10μm, which can ensure the capacitance value (40pF), and at the same time minimize the damping of the extruded film and improve the sensitivity of the sensing unit (7×10¹¹(V/m)) ;
3) In the damped and undamped state, the resonant frequency of the sensing unit is 105kHz and 104.87kHz, respectively, with a deviation, is 0.124%, which verifies the feasibility of the sensing unit design.
Through the design and finite element analysis of the in-plane sensing unit, the following conclusions are obtained:
1) The U-shaped spring reduces the stiffness in the z-direction and obtains a smaller resonant frequency (312.59 kHz, 301.05 kHz), which can obtain a higher resonant frequency (470.61khz, 426.95khz) compared with the x and y directions, effectively isolating the required mechanical response in the plane from the unwanted out-of-plane response.
2) The in-plane sensing unit has a small chip area (5mm x 5mm x 1mm), with high sensitivity, strong anti-interference ability, good stability, and simple manufacturing.
