Swipe, Scroll, and Stretch Marks: A Cross-Sectional Study of Striae Distensae Content on TikTok
Received Date: February 04, 2026 Accepted Date: February 10, 2026 Published Date: February 14, 2026
doi:10.17303/jdct.2026.1.201
Citation: Anvitha Makkena, Isoo Yoon BS, Ava Bruner BS, Adrianne Pan MD, Lilia Correa MD, FAAD, FACMS (2026) Swipe, Scroll, and Stretch Marks: A Cross-Sectional Study of Striae Distensae Content on TikTok. J Dermatol Cosmet Ther 1: 1-10.
Abstract
Striae Distensae (SD) are dermal scars caused by excessive tension of the skin. Social media platforms, such as TikTok, have started to advertise products claiming to reverse SD appearance.
In this study, we conducted a cross-sectional analysis of 143 TikTok videos on SD content. Videos were categorized by creator type, and engagement was measured using Video Power Index (VPI). Reliability was assessed using modified DISCERN/JAMA scoring. Spearman’s correlation was used to evaluate the relationship between reach and educational quality.
Inter-rater reliability was strong for DISCERN scores (Kw = 0.759 p < .001), weak but statistically significant for JAMA scores (Kw=0.272 p < .001). Consumers created the majority of SD content (50%) with Physicians accounting for the smallest proportion (13%). Consumers/Influencers demonstrated the highest engagement (4.53 ± 5.92). Physicians achieved the highest mean DISCERN scores for Reviewer 1 and Reviewer 2 (2.78 ± 0.81 and 2.61 ± 0.61). They also received the highest mean JAMA scores (1.89 ± 0.32 and 1.28 ± 0.46). Private companies received the lowest DISCERN scores (1.00 ± 0.25 and 0.97 ±0.30), and consumers demonstrated the lowest JAMA scores. A moderate positive correlation was observed between VPI and DISCERN for both reviewers (ρ=0.361 and 0.316; p < .001), while correlations between VPI and JAMA were non-significant.
The predominance of high-engagement content produced by consumers, despite lower educational quality, highlights the need for more oversight to limit misinformation on TikTok.
Keywords: Stretch Marks, TikTok, Dermatology Education
Introduction
Striae Distensae (SD), commonly known as stretch marks, are linear dermal scars which may result from mechanical tension of the skin. Common causes include excessive or rapid stretching during periods of growth, as seen in pregnancy, adolescence, and obesity [1]. In addition to mechanical stress, pathogenesis is influenced by hormonal factors, specifically increased expression of estrogen, androgen, and glucocorticoid receptors, exogenous and endogenous sources of corticosteroids, and genetic predisposition [2]. These factors contribute to impaired extracellular matrix remodeling and ineffective repair of collagen and elastic fibers.
Stretch marks are benign but can cause significant psychological distress due to their cosmetic appearance. Stress may stem from self-perception or societal beauty standards. Early appearance of stretch marks presents as erythematous, violaceous, linear streaks aligned perpendicular to the direction of mechanical stress, termed Striae Rubrae. However, with time stretch marks mature, becoming hypopigmented and atrophic. This is termed Striae Albae. In the mature form, stretch marks present as pale, depressed, and wrinkled linear plaques with reduced skin thickness [3].
Compounding psychological distress is the limited scope of treatment currently available for SD. Few active ingredients have demonstrated efficacy in reducing the appearance of SD. Common treatment regimens involve tretinoin, glycolic acid, and to a lesser extent Vitamin C. These may be effective for Striae rubrae. However, for Striae albae, these active ingredients have not been proven similarly efficacious [3]. Moreover, there is insufficient high-quality evidence to support the use of most commercially available topical products. Vascular lasers and CO2 lasers are also acceptable treatments. Studies have demonstrated that fractional CO2 lasers improve striae appearance by stimulating dermal remodeling, especially when combined with Q-switched Nd:Yag treatments [4].
TikTok is a social media platform where users create short videos on a variety of topics. From entertainment to educational content, TikTok has increasingly started to discuss dermatological conditions, including SD. While TikTok hosts an accessible platform for dermatologists to connect with patients and share their expertise, current dermatology trends are not led by board certified dermatologists [5].
Furthermore, the addition of the TikTok Shop feature has introduced monetary incentivization for content creators receiving paid promotions for product sales [6,7]. Products and advertisements related to SD have reached over 87 million views [8]. Yet only 5.2% of top skincare TikTok promotions are created by dermatologists. Instead, the majority of SD related content is created and promoted by bloggers, influencers, and estheticians [8]. While evidence-based practices may be effectively communicated and shared to the public by individuals outside of the medical profession, prevalence of monetary compensation may increase potential viewer exposure to and use of non-evidence-based treatment products. Such products pose a significant risk to patient safety [9].
In this study, we examine the credibility and reliability of TikTok SD content. While prior studies have examined pregnancy-related stretch mark recommendations, our study expands this work by evaluating SD across multiple causes that affect multiple age ranges while applying validated assessment tools, including DISCERN and JAMA criteria, to quantitatively assess variability in educational quality and its relationship with creator type and engagement. Such characterization may suggest increased need for improved media literacy, professional intervention, or more robust regulation to mitigate public health risk.
Objective
While SD is a top widely discussed topic on social media, as well as TikTok, limited research has examined the extent of reach and impact of this content. Given how popular this platform is with younger audiences, there is more of a scope for related content to go viral, especially concerning the spread of misinformation and treatment claims not supported by clinical evidence. This lack of regulation along with the secondary self-promotional motives of content creators with the introduction of TikTok shop further blurs the line between education and advertisement. As a result, we wanted to analyze TikTok content to assess the validity of the media presented online on platforms driven by not just engagement but also monetization.
Methods
A cross-sectional review of TikTok videos related to SD was conducted between May 22nd, 2025, to June 21st, 2025. After initial review, hashtags such as #striae distensae and #tiger stripes were excluded due to lack of relevant content and association with striae distensae itself. Two hashtags, #stretch marks and #stretch mark removal, satisfied the study objectives, and the top 100 videos for each hashtag were selected, for a total of 200 videos. The search was conducted using a newly created TikTok account to minimize algorithmic bias and was sorted by popularity.
Videos were included if they were in English and directly relevant to the appearance or treatment of stretch marks. Videos were excluded if they were unrelated to SD, in a non-English language, or duplicates.
The Video Source variable was created by categorizing the origin of the videos into four groups: 1 = Physician, 2 = Consumer/Influencer, 3 = Private Company, 4 = Beauty Professional. Physicians were defined as individuals with a medical degree. The consumer/influencer group comprised of everyday users creating content for popularity, while the private company group consisted of organizations creating content to promote products or services. Beauty professionals were defined as cosmetologists, estheticians, and/or other certified skin, nail, and hair specialists. Engagement was quantified using the Video Power Index (VPI), calculated as (likes + comments) / views. The VPI category was created by categorizing the variable into four engagement levels: 1 was characterized as Low Engagement (VPI Score 0-1), 2 was Moderate Engagement (VPI Score 1-3), 3 was High Engagement (VPI Score 3-6). 4 was Very High Engagement (VPI Score 6+).
To assess the quality of information presented, two blinded co-authors in medical school independently scored each video using DISCERN and JAMA benchmarks. DISCERN consists of a 5-point scale, with 1 signifying low quality and poor reliability and 5 signifying high quality and reliability. The JAMA benchmark consists of a 4-point scale, with 1 signifying low reliability and 4 signifying high reliability and currency. These two assessments are generally used to question and analyze the quality of written information on treatment choices, so a modified questionnaire system was utilized to account for the change in media to a video format (10). For DISCERN, five of the original sixteen questions were selected that were most applicable to short videos (Table 1). Each video was assessed for whether it fulfilled the question’s criterion, with a score of 1 or 0, and receiving a total, summed DISCERN score ranging from 0-5. This format was used because short-form videos rarely provide the depth needed for a Likert-scale evaluation. For JAMA, benchmark criteria were applied using the standard four domains of Authorship, Disclosure, Attribution, and Currency (Table 2).
Descriptive statistics were calculated for continuous variables, while frequencies and percentages were reported for categorical variables. The Inter- Rater Agreement between two raters on DISCERN and JAMA scale scores on the reliability of videos sharing information was calculated using Weighted Kappa statistics (11). The video sources were assessed with continuous variables using the non-parametric Mann-Whitney U test. Spearman's Correlation test was used to evaluate the relationship between continuous covariates. A p-value of < .05 was considered statistically significant. All analyses were conducted using SPSS Version 30.
Results
Of the 200 TikTok videos collected, 57 videos were removed for duplicates or irrelevance to objective.
Creators
Of the initial 143 TikTok videos analyzed, 13% were created by BCDs, 50% were created by content creators/influencers, 14% by beauty professionals (estheticians, tattoo artists, etc.), and 23% by private companies (Figure 1). For #stretchmarks, consumers/influencers were the top creators (50%) followed by private companies (29%), beauty professionals (12%), and BCDs (9%). For #stretchmarksremoval, consumers/influencers were the top creators once again (50%), followed by private companies (18%), BCDs (17%), and then beauty professionals (15%). Combined for both hashtags, 26% of SD TikTok videos are created by a licensed professional.
Views, Likes, Shares, Comments, and Saves
In total, the videos amassed 467.2 million views. Private companies received the most views, with over 208 million views, followed by influencers (134.7 million), then beauty professionals (89.6 million), and lastly BCDs (38.3 million) (Figure 2). As for likes, the videos totaled 15.4 million likes, with consumers/influencers receiving 5.8 million likes, private companies receiving 4.7 million likes, beauty professionals receiving 2.9 million likes and BCDs receiving 2.1 million likes (Figure 3). As for shares, the videos totaled 847.3 thousand. Consumers/Influencer content was shared 495.2 thousand times, private companies 210.8 thousand, beauty professionals 77.8 thousand, and BCDs 63.5 thousand. There was a total of 122 thousand comments across all videos, with consumers/influencer content receiving 63.3 thousand comments, private companies receiving 28.6 thousand, beauty professionals 19.5 thousand, and BCDs receiving 10.6 thousand. The videos amassed 2.4 million saves, with consumers/influencer content receiving 1.1 million, BCDs receiving 593.8 thousand saves, private companies receiving 515.2 thousand, and beauty professionals receiving 236.3 thousand.
Content Type
Excluding duplicated and irrelevant content, 33 TikTok videos were characterized as general information, 11 as body positivity-related, and 99 as product reviews. For general information, 17 videos were produced by BCDs, 13 by consumer/influencers, 2 by beauty professionals, and 1 by private company. For videos characterized as a product review, 1 was created by BCDs, 50 by consumers/influencers, 17 by beauty professionals, and 31 by private companies. All body positivity-related videos were created by consumers and influencers, except 1 which was created by a private company.
Descriptive and Comparative Analysis
From the first 200 videos, 143 were included in the final analysis, after excluding irrelevant and duplicate content. These videos demonstrated a wide range of engagement and educational literacy. Inter-rater reliability showcased strong and statistically significant agreement between Reviewer 1 and Reviewer 2 for DISCERN scores (Kw = 0.759; 95% CI, 0.668–0.850; p < .001). The JAMA inter-rater agreeability showcased a weaker but still statistically significant trend (Kw=0.272; 95% CI, 0.068–0.476; p < .001).
Engagement was measured by Video Power Index (VPI) and varied by creator type: Consumers (4.53 ± 5.92), Beauty Professionals (4.15 ± 7.38), Physicians (3.80 ± 2.18), and Private Companies (2.34 ± 1.60).
For DISCERN, Reviewer 1 assigned physicians a mean of 2.78 ± 0.81 and Reviewer 2 a mean of 2.61 ± 0.61. For JAMA, Reviewer 1 assigned physicians a mean of 1.89 ± 0.32 and Reviewer 2 a mean of 1.28 ± 0.46. Consumers/Influencers received a Reviewer 1 DISCERN mean score of 1.29 ± 0.46 and a Reviewer 2 mean DISCERN score of 1.16 ±0.56. They also received a Reviewer 1 mean JAMA score of 1.00 ± 0.00 and a Reviewer 2 mean JAMA score of 0.91 ± 0.33.
Private companies received a Reviewer 1 mean DISCERN score of 1.00 ± 0.25 and a Reviewer 2 mean DISCERN score of 0.97 ±0.30. They also received a Reviewer 1 mean JAMA score of 1.00 ± 0.00 and a Reviewer 2 mean JAMA score of 0.97 ± 0.17. Beauty professionals received a Reviewer 1 mean DISCERN score of 1.11 ± 0.32 and a Reviewer 2 mean DISCERN score of 1.05 ±0.40. And lastly, they received a Reviewer 1 mean JAMA score of 1.00 ± 0.00 and a Reviewer 2 mean JAMA score of 1.11 ± 0.32. The videos created by physicians met the highest DISCERN and JAMA criteria. Private companies on the DISCERN scale seemed to meet the least criteria, while consumers/influencers seemed to meet the least JAMA criteria (Table 3).
As far as correlation, there is a statistically significant and moderate correlation between Video Power Index and the total DISCERN score of both reviewer 1 and reviewer 2 (Spearman's rho = 0.361, [95% CI - 0.203, 0.500], p < 0.001 and Spearman's rho=0.316, [95% CI - 0.155, 0.462], p < 0.001 respectively). Additionally, there is a statistically positive and weak correlation between the Video Power Index and total JAMA score for reviewer 1 (Spearman's rho=0.188, [95% CI - 0.019, 0.347], p=0.025). No significant correlation was found between the Video Power Index and the total JAMA score of reviewers 2 (Spearman’s rho=-0.007, [95% CI -0.177,0.164], p=0.937) (Table 4).
Discussion
In this cross-sectional content analysis of TikTok videos tagged #stretchmarks and #stretchmarkremoval, we examined patterns in content creation, engagement metrics, and information quality measured by DISCERN and JAMA scores across distinct creator types. Our findings highlight a disconnect between evidence-based accuracy and audience reach.
Principal findings
The predominant creators included consumer and influencer accounts, producing 50% of all initially sampled content, comprising 50% and 50% of #stretchmarks and #stretchmarksremoval respectively. In contrast, BCDs had the lowest video count with 13% of total content, 9% and 17% of #stretchmarks and #stretchmarksremoval respectively. In aggregate reach, private companies obtained the highest total view count (208 million), but it did not yield matching engagement rates; Influencer content commanded greatest engagement, measured by the number of likes, shares, and saves. The computed video power index (VPI) showed highest mean values for influencers (4.53 ± 5.92) and beauty professional (4.15 ± 7.38) creators, followed by physicians (3.80 ± 2.18) and private companies (2.34 ± 1.60). Although private company videos attracted viewers, they were less effective at eliciting a more thorough interaction.
Evaluation of informational integrity via DISCERN and JAMA scoring system found that physician-created videos consistently outperformed other categories. Physicians achieved a mean DISCERN score of 2.78 ± 0.81 (Reviewer 1) and 2.61 ± 0.61 (Reviewer 2), and JAMA scores of 1.89 ± 0.32 and 1.28 ± 0.46. In contrast, consumer/influencer, private company, and beauty professional content scored poorly on both instruments, often failing to meet minimal criteria for transparency, attribution, evidence discussion, or risk disclosure.
A moderate positive correlation was observed between VPI and DISCERN for both reviewers (Spearman’s ρ = 0.361 and 0.316, respectively; p < 0.001), indicating that higher quality content modestly aligns with engagement. However, the correlation between VPI and JAMA was weak or nonsignificant; implying certain quality indicators (e.g. authorship disclosure) may not predict virality.
Interpretation and Implications
These findings reflect a broader challenge in digital dermatology, with users often turning to popular social media rather than clinically rigorous sources.
Influencer content is prolific and highly engaging, but low in quality, suggesting a high-risk environment for misinformation or incomplete guidance to dermatological conditions. This vacuum of information is further exacerbated by the underrepresentation of BCDs and other credentialed professionals on online platforms.
The discrepancy between information accuracy and audience engagement emphasizes the need for dermatologists and academic societies to adopt communication strategies tailored to short-form video dynamics. Collaborating with influencers, optimizing visual design, and embedding credible references or disclaimers could help improve evidence-based content compete. Regulatory efforts or platform incentives might help encourage transparent disclosures and accountability in commercial content.
Commercialization, Body Positivity, and Misinformation
The predominance of product review content in the study underscores the growing commercialization of dermatological discourse on social media. Most of the videos analyzed centered on promotion or evaluation of stretch mark related products, most lacking transparency and disclosure of sponsorship or advertising objectives. The lack of transparency can contribute to consumer confusion, perpetuating misinformation over the efficacy of topical and over the counter products of striae distensae.
The theme of body positivity also emerged in the dataset, reflecting an important psychosocial dimension of dermatology discourse on social media. Videos emphasizing acceptance of stretch marks reframed them as natural variation of human skin rather than flaws to be corrected. This contrast between commercial or removal-focused videos and self-love focused videos can influence self-perception, body satisfaction, and mental well-being among viewers, especially with TikTok’s predominantly young female demographic.
Dermatologists could include more body acceptance narratives that can serve as a novel avenue for public health engagements, simultaneously addressing misinformation and promoting resilience against appearance-based stigma.
Limitations
Limitations of the study include the cross-sectional design and volatility of the platform, as algorithmic changes can alter exposure dynamics. Additionally, from initial video ID collection to analysis, some videos were turned “private”, inhibiting access for analysis and not befitting the inclusion criteria. Content analysis methods such as DISCERN and JAMA, while validated, may include bias, as they do not capture rhetorical persuasiveness, editing sophistication, or viewer trust that may be more geared towards short-form content. Future research should longitudinally track content trends, assess viewer comprehension and behavioral impact, and experimentally test physician-led interventions to boost reach.
Acknowledgements
The authors would like to thank Veena Jajoo affiliated with Research, Innovation, and Scholarly Endeavors (RISE) at the University of South Florida for her help with statistical analysis.
Disclosure
Authors report no conflicts of interest or relevant financial relationships related to the content of this manuscript.
- Lokhande A, Mysore V (2019) Striae distensae treatment review and update. Indian Dermatol Online J. 10: 380.
- Chang ALS, Agredano YZ, Kimball AB (2004) Risk factors associated with striae gravidarum. J Am Acad Dermatol. 51: 881-5.
- Karhade K, Lawlor M, Chubb H, et al. (2021) Negative perceptions and emotional impact of striae gravidarum among pregnant women. Int J Womens Dermatol. 7: 685-91.
- Ustuner P (2025) Comparative Analysis of Laser Therapies for Striae Distensae: Fractional CO₂ vs Combined Q-Switch Nd:YAG. Med Sci Monit Int Med J Exp Clin Res. 31: e947464.
- Nguyen M, Youssef R, Kwon A, et al. (2021) Dermatology on TikTok: Analysis of content and creators. Int J Womens Dermatol. 7: 488-9.
- DemandSage. How Many People Use TikTok in 2025 (Active Users Stats). Available at: https://www.dem andsage.com/tiktok-user-statistics/. Accessed June, 21, 2025.
- Phan DH, Nguyen QD, Phuc VKN (2024) Dataset on Vietnamese students’ impulse buying behavior on TikTok shop. Data Brief. 57:111047.
- Ambardekar SS, Burkhart CG (2025) Stretching the Truth: Analyzing Pregnancy Stretch Mark Recommendations on Social Media. Open Dermatol J. 19: e18743722366578.
- Barta S, Belanche D, Fernández A, Flavián M (2023) Influencer marketing on TikTok: The effectiveness of humor and followers’ hedonic experience. J Retail Consum Serv. 70: 103149.
- Oxford Population Health. DISCERN: Assessing Quality of Consumer Health Informationn. Available at: https://www.ndph.ox.ac.uk/research/research- groups/applied-health-research-unit-ahru/discern. Accessed: June, 21, 2025.
- McHugh ML (2015) Interrater reliability: the kappa statistic. Biochem Medica. 22: 276-82.
FIGURE 1
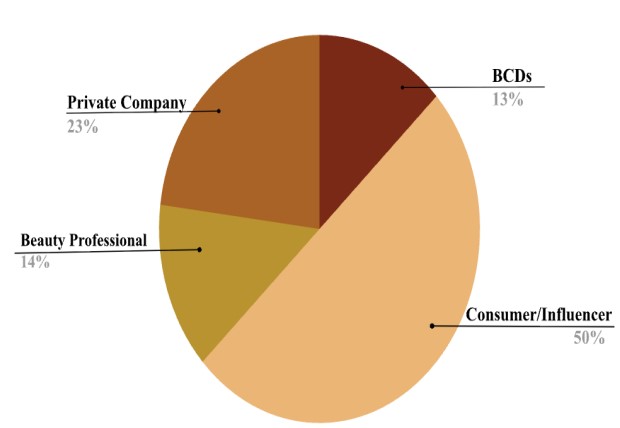
Figure 1: Percentage distribution of Striae Distensae-related TikTok videos by creator type.
FIGURE 2
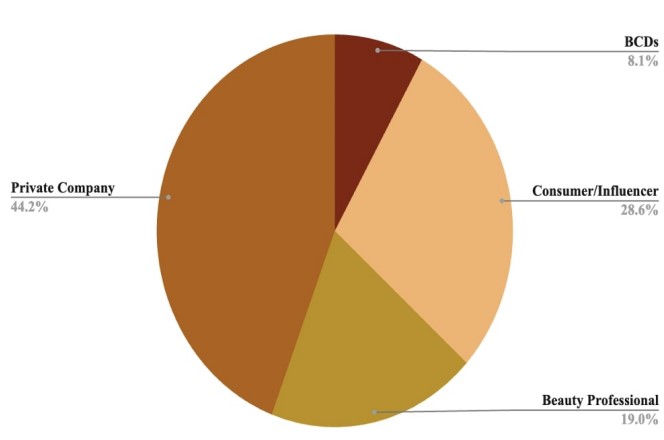
Figure 2: Percentage distribution of total views for SD TikTok content by creator type.
FIGURE 3
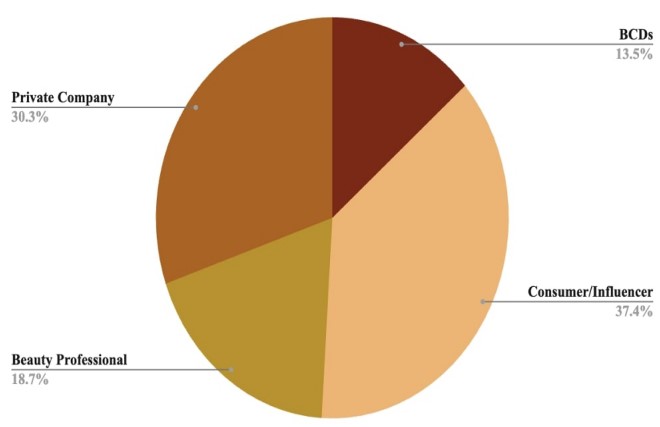
Figure 3: Percentage distribution of likes of SD TikTok content by creator type.
Tables at a glance
Figures at a glance