Simulating HIV Transmission Dynamics and Predicting the Impact of Testing Policies in Men Who Have Sex with Men in the UK, France, and Poland
Received Date: June 16, 2020 Accepted Date: July 14, 2020 Published Date: July 16, 2020
doi: 10.17303/jaid.2020.7.102
Citation:Raffaele Vardavas (2020) Simulating HIV Transmission Dynamics and Predicting the Impact of Testing Policies in Men Who Have Sex with Men in the UK, France, and Poland. J HIV AIDS Infect Dis 7: 1-18.
Abstract
Modelling studies have been undertaken in various contexts to project the effectiveness of the test and treat strategies for HIV worldwide. In this paper we present the findings from the calibration of a mathematical model built for LA county and adapted to the European context, focusing on France, Poland, and the UK, as well as predictions for these countries for different testing rates and an assessment of how these testing rates could be achieved. We used a systems dynamics approach to model the dynamics of HIV in the MSM population, dividing individuals into eight HIV infection statuses: susceptible and HIV negative (S), infected in the primary stage of infection (P), HIV+ unaware (I), diagnosed infected but not treatment-eligible according to the guidelines at the time of diagnosis(J), HIV+ and treatment-eligible (E), treated but no progression to AIDS (T), progression to AIDS but not treated (A), and progression to AIDS and treated (TA). Parameters informing the transmission model describe how HIV-positive MSM progress between disease states and treatment and the rate at which HIV positive MSM sexually transmit HIV to susceptible MSM. Our model shows the variability in the uptake of testing and treatment for HIV in the MSM population across three European countries. However, increasing the testing rate of HIV in MSM contributes to reducing the prevalence of HIV+ unaware MSM in different ways in the three countries. Additionally, increasing the testing rate leads to a reduction in the incidence of diagnosed HIV infection among MSM. However, we find that the possible marginal increases in testing rates are very different across the three countries. Increasing existing intervention policies to encourage testing and treating for HIV would be most beneficial to the MSM population in France and Poland. We showed our model can be used to predict the impact of policy changes on the populations in these countries going forward.
Keywords: HIV; test and treat; men who have sex with men
Introduction
Evidence on the reduction of risk of HIV transmission when antiretroviral therapy (ART) is initiated early as opposed to initiating ART when the CD4 cell count is below a certain threshold (500 cells/mm3 in 2013 guidelines) has provided support to the revision of WHO guidelines and recommendations on starting ART for all HIV-positive persons, regardless of CD4 cell count [26]. This strategy is known as ‘test and treat’ and relies on the use of ART as prevention therapy by decreasing the viral load in infected patients, therefore interrupting viral transmission [1,3,5,12, 21, 23, 24].
Modelling studies have been undertaken in various contexts to project the effectiveness of the test and treat strategies [13,16,21]. For example, one study looked at men who have sex with men (MSM) in New York and explored the effect of increasing testing rates, linkages to care, and early initiation of ART on the cumulative number of HIV infections over 20 years [21]. The model predicted that doubling annual testing rates and initiating ART where the CD4 cell count is less than 500 per mm3 could reduce cumulative new infections by 39.3%, with the largest effect coming from the increase in testing rates.
In European countries, mathematical models have been used to estimate the incidence of HIV among different population groups, mostly MSM, and to map the evolution of infection under different scenarios, providing insights into the potential impacts of different policies. For example, one study based in the UK found that, if ART had been introduced for all individuals diagnosed with HIV since 2001, there would have been 32% lower incidence rate of HIV among MSM [16].
For the European Union (EU)/European Economic Area (EEA), it is estimated that 15% of people living with HIV are still unaware of their status [7]. Furthermore, almost half of existing cases are diagnosed late, defined as having a CD4 cell count below 350 cells/mm3 blood at the time of diagnosis [8]. Late diagnosis and unknown HIV status are thought of as indicating gaps in HIV testing services, with half of all EU/EEA countries reporting gaps in testing services for migrants, MSM, and sex workers [7]. While progress in terms of initiation of treatment is noted, 1 in 6 people in the EU/EEA diagnosed with HIV still remains untreated [7]. Therefore, there is a clear gap emerging between policy and implementation.
Adopting a test and treat approach comes with challenges. Deploying any ART-based prevention strategy raises a complex array of interdependent issues, including access, cost, impact on behavior and health, implementation, and the possibility of drug resistance developing. Another factor is the history and prevalence of HIV in a country – countries with a long-established HIV epidemic are thought of as being more likely to be proactive in adopting new recommendations [27]. Further challenges relate to the characteristics of countries' health systems. For example, some studies have found that health systems in which HIV treatment is decentralized tend to be slower to take up new guidelines [27]. Other factors that may block the adoption of new guidelines include the level of knowledge among policymakers, the degree of effectiveness of government policy decision-making mechanisms, and stigma associated with HIV [15].
To understand the impact of different barriers to test and treat for the MSM population in Europe, as well as the effect of interventions aimed at addressing these barriers, we adapted a model for Los Angeles County (LAC), USA [20], to three EU/ EEA countries at different stages on the continuum of care: the UK, France, and Poland.
The United Kingdom (UK) has a relatively small HIV epidemic, and it has nearly achieved all targets from the UNAIDS 90-90-90: 87% of people infected with HV are aware of their status, 96% of those aware are receiving treatment, and 94% of those receiving treatment are virally suppressed [19]. UK policies against HIV transmission focus on combination prevention consisting of condom use, expanded HIV testing, prompt ART, and pre-exposure prophylaxis (PrEP). Since 2008, national guidelines have recommended all MSM should be offered routine HIV testing -annually or trimonthly if clinical symptoms are suggestive of seroconversion or if there is ongoing high-risk exposure [2]. This has resulted in the number of MSM tested for HIV to steadily rise since 2012, with 89% of MSM who attended sexual health services who were eligible for testing being tested for HIV in 2016 [18]. National guidelines also recommend starting ART regardless of CD4 count to prevent onward transmission, leading to a rise in the number of men starting ART from 2,700 in 2013 to 3,600 in 2015 [17]. Furthermore, since 2013 PrEP became available to MSM on the NHS.
France is also making progress towards achieving the UNAIDS 90-90-90 targets: having achieved the second and third 90s (90% or greater) but requiring progress towards the first 90 [17]. In France, for MSM it is recommended men be tested for HIV every three months [4]. HIV tests should also be offered under different circumstances, including diagnosis of sexually transmitted infections (STI), hepatitis B, hepatitis C or TB, pregnancy, rape, abortion, prescription of contraception, and/or incarceration. Additionally, Public Health France recommends HIV testing at least once in a lifetime between 15 and 70 years of age to allow the diagnosis of people who are unaware of their HIV status and to reduce the burden of the hidden epidemic. Guidelines state any individual living with HIV should be treated with ART, irrespective of their CD4 cell counts or HIV plasma viral load [4].
Poland is considered a low prevalence country for HIV with a stable epidemiological situation. However, of the three countries considered in this study, it is the furthest from achieving the 90-90-90 target set out by UNAIDS. It is estimated that only 57% of people infected with HIV are aware of their HIV status, 36% of people living with HIV are on ART, and only 32% of those receiving treatment have suppressed viral load. Moreover, Poland is facing a likely influx of HIV-positive individual from other Eastern European countries, mainly the Russian Federation and Ukraine, where the epidemic is increasing [25]. Testing is recommended for individuals presenting with an STI, for those admitted for in-patient drug dependency treatment, MSM, prison inmates, and those presenting symptoms suggestive of HIV infection [22]. However, there are no specific screening programs for high-risk groups. Polish policy aimed at increasing testing, especially among high-risk populations such as MSM, is based on a system of voluntary counselling and testing (VCT) sites. VCT consists of individuals actively seeking HIV testing and counselling at a facility that offers these services. Upon diagnosis of HIV, Poland recommends ART initiation, regardless of CD4 cell count.
This paper presents the findings from the calibration of the LAC mathematical model, predictions for these countries for different testing rates, and an assessment of how these testing rates could be achieved. This model is complemented by a qualitative assessment of the barriers to accessing HIV testing and the interventions in place aimed at overcoming these barriers in these countries, as well as a view of the wider European context [28]. Together, the quantitative and qualitative assessment of the barriers and interventions will enable the assessment of policy interventions that would most benefit the MSM population in the different European countries regarding seeking testing for HIV.
Methods
Model choice and structure
We used a system's dynamics (SD) approach to model the dynamics of HIV in the MSM population. SD is an approach to understanding the nonlinear behavior of complex systems over time using stocks, flows, internal feedback loops, and time delays. Further details on our approach are provided by Vardavas R, et al [29]. To model the HIV/AIDS epidemic in the MSM population in the UK, France, and Poland, we calibrated a deterministic epidemiological model that was previously used to describe the HIV epidemic in the MSM population in LAC [20]. Our calibration was based on matching the HIV incidence data compiled by the European Centre for Disease Prevention and Control (ECDC) from 2002 to 2014. We obtained the set of model parameters that best reproduce the trend in HIV/AIDS incidence for the MSM populations in the three countries. To run the model, the prevalence of undiagnosed and diagnosed HIV and AIDS in the MSM population was estimated for the initial year we had incidence data for, and for one additional year closer to the end of the range of the calibration years. Further details on the data sources for the incidence and prevalence data are provided in section 3.1 and 3.3 of the Technical Report. We focus on the MSM population since they represent over 40% of newly diagnosed cases of HIV and AIDS in the EU and they are likely to have different characteristics than the heterosexual population. For the purposes of this study, we assume that intravenous drug use does not largely contribute to new MSM infections (see Technical Appendix for more detail).
Our model is illustrated in Figure1. Individuals are divided into eight key HIV infection statuses: susceptible and HIV negative (S), infected in the primary stage of infection (P), infected and unaware of being infected (I), diagnosed infected but not treatment-eligible (J), infected and treatment-eligible (E), treated but no progression to AIDS (T), progression to AIDS but not treated (A), and progression to AIDS and treated (TA).
Parameters informing the transmission model describe how HIV positive MSM progress between disease states and treatment and the rate at which HIV positive MSM sexually transmit HIV to susceptible MSM. Key parameters for this study include the rate that treatment eligible individuals initiate and adhere to treatment (σ, and g), the rate at which unaware HIV positive individuals get tested for HIV and diagnosed with early and treatment in-eligible stage HIV (ω), the rate at which unaware HIV positive individuals get tested for HIV and diagnosed with a later and treatment eligible stage HIV (χ), the rate at which unaware HIV positive individuals get tested for HIV and diagnosed with AIDS (ωA.), the average number of new sex partners per year with which a typical MSM individual engages in unprotected sex (c) and the probability of HIV transmission per sexual partnership (β). The latter is known as the transmissibility parameter. To account for different biological infectiousness levels as well as risky sexual behavior activity at different disease stages, the transmissibility parameter is unique for each model compartment representing an infectious state. We thus have a set of seven transmissibilities (β_X). These per-partnership transmissibilities are related to the biological per-act infectivities (α_X), which are determined by analyzing viral load data. A key model assumption is that HIV positive individuals, aware of their serostatus, significantly reduce risky behaviour; we account for this by ensuring the sampling range of transmissibility for stage J (i.e. β_J) is lower than the sampling range of transmissibility for stage I (i.e.β_I). HIV incidence is modeled by the transition of individuals from the susceptible population to the primary infection state (Ps). This occurs at a rate that is known as the force of infection, given in terms of the transmissibilities as λ_ = c∑_(X_ )▒β_(X_ ) X_ /N. Here, N represents the total population given by the sum of the susceptible and all infected states.
We revised the model parameter values and their uncertainty ranges that were used in our previous study for LAC and adapted them to the settings for our three European countries. Parameters describing biological rates such as the per-act infectivities and the added HIV related mortality rates for each disease status (γ_X) were either not modified or marginally modified. Instead, behavioural and policy-related parameters such as the average number of new sex partners per year, the proportion of sex acts that involve unprotected sex and testing and treating rates were revised. The process of revising these parameters is described in the following sections and in the appended Technical Report.
Calibration
The data made available by ECDC provided the cumulative number of MSM that were diagnosed with HIV at different stages. The raw data were used and interpreted to provide the cumulative number of MSM that were diagnosed with HIV in stages J, E, and A for each country. Incidence data for Poland were not split by CD4 count and therefore it was not possible to split between the stages J, E and A. We, therefore, relied on incidence data from Romania to determine how to separate the cumulative number of MSM that were diagnosed with HIV to the three diagnosed infection stages. Romania was chosen as it had a similar trend in overall incidence rate over time compared to Poland.
These data were used for two purposes. The first purpose was to develop our calibration targets for our simulation model. The model tracks the cumulative yearly incidence I -> J, I -> E, and I -> A and case runs that use different combinations of the sampled values of the model parameters are selected in a way that minimizes the error between the observed data and our model outputs. We refer to this step as model calibration. The second purpose was used to estimate the parameter values describing testing rates ω (the rate at which unaware HIV positive individuals get tested for HIV), χ, and ωA
Ideally, yearly prevalence data for each disease state would also be available and would be used for calibration purposes. However, prevalence data were not easily available. Ideally, the model would be informed by at least one year of prevalence for each disease state and the number of MSMs that are susceptible, as the prevalence states form part of the initial conditions. Further details on how prevalence data were estimated can be found in the Technical Report.
Modelling HIV infection in Europe
Following calibration, the model for the UK (Figure 4 of the Technical Report) and France (Figure 5 of the Technical Report) revealed that our estimates for prevalence and population estimates for the number of MSM in the year 2002 and year 2011 for the HIV susceptible population, the HIV+ undiagnosed population (i.e. unaware of their HIV positive status) and the HIV+ diagnosed population (i.e. aware of their HIV+ status), are consistent with the incidence data that we used. These results show the model can reproduce the incidence dynamics for the UK and for France, while also reproducing the estimated prevalence data. However, this is less so for Poland. We see that compared to the UK and France, the error produced by the calibration is larger for Poland (Figure 6 of the Technical Report). Further details can be found in the Technical Report.
Forward simulation
To run forward simulations, we selected the top 200 cases for each country. These cases were used for our model projections from 2020 to 2035. We first used these selected cases and ran the model each from 2002 to 2020 (from 2008 for the case of France as that is the period we were able to calibrate the model for France). During these years we made different assumptions regarding how the diagnosis rate changed over these years. For France and Poland, these rates were constant from 2010 onwards. Instead, for the case of the UK, we assumed a linear increase in the diagnosis rate. In these runs, we assumed that the trend for diagnosis rate for each country continues to 2020. Therefore, in particular, for the case of the UK, the rate continues to increase linearly to the year 2020. Then from 2020 to 2035 we fix the value of to its 2020 value and run the model forward. These sets of runs represent our baseline case scenario as they assume that the probability of an MSM of being tested per year remains constant at the 2020 level. We further considered a range of different scenarios whereby we varied the value of for the years 2020 to 2035 between 50% to 400% of its baseline value.
Impact of barriers to accessing testing for HIV in the different countries and interventions aimed at addressing the barriers
Barriers to accessing testing for HIV in MSM in France, Poland, and the UK were identified as described in Rodriguez-Rincon et al. [28]. Briefly, we focused mainly on two documents provided by ECDC [14], which provide detailed and up-to-date information on the barriers faced by MSM across Europe. To identify the interventions and understand the extent of implementation of these across Europe, we conducted two searches on PubMed using the following search terms: "[intervention] for HIV in Europe" (search 1) and "[intervention] for HIV in [Poland OR France OR United Kingdom]" (search 2). The interventions searched were: self-testing, rapid HIV tests, risk assessment questionnaires, voluntary anonymous partner referral, social media marketing campaigns, mobile testing services, testing in various settings, and regular sexually-transmitted infection screening.
Representatives from organizations (clinicians, charity/advocacy groups, policymakers, researchers/academics, and non-governmental organizations) of barriers and interventions, and did not cover possible future impact. The list of barriers and interventions was developed thorough desk research.
Modelling the impact of the barriers and interventions on the baseline testing rate
Drawing on the quantitative and qualitative data collected through our survey and interviews, we modeled the testing rate of each country as being related to the barriers and interventions available in each country, proportionally to the score given to that barrier and intervention within the survey. A barrier was considered as more of an impediment to testing if it was given a higher score; an intervention was seen as more useful for increasing the testing rate if it was given a higher score. The interventions are directly linked to the barriers as shown within our graphic that links the barriers and interventions (Figure 11 of the Technical Report). This graphic was designed based on the literature and updated based on the qualitative responses from interviews explaining additional interactions between interventions and barriers. The graphic shows that there are some barriers that have no interventions affecting them. Other barriers are instead affected by more than one intervention. As a first step, we analyzed how the responses of the experts on barriers and intervention ratings correlated with the value for the diagnosis rate for each country in the year 2020 used by the simulation model. We found that the average ratings of the barriers across the different countries do not vary much and are not correlated with the year 2020 diagnosis rate. In contrast, we found that the average ratings of interventions were positively correlated with the diagnosis rate across the countries. We, therefore, decided to construct a linear regression model linking the diagnosis rate across the countries to the intervention ratings. In our regression model, the weight multiplying each intervention rating was assumed to be equal to the sum of the ratings of the barriers it affects. Ratings of barriers that are not affected by any of the interventions were averaged and considered as a second term in the regression model. Thus, our regression model can be expressed as:
ω=s(w⋅I)+κ⟨B_out ⟩+K,
where w is a vector of weight that multiply the ratings of the intervention I,⟨〖 B〗_out ⟩ is the average rating of the barriers that are not affected by the interventions, and K is a constant. The parameters s and κ are scaling coefficients that transform the ratings in the first two terms into the same units as the diagnosis rate. These coefficients are determined by our regression model.
The model assumes that barriers, and interventions on barriers, are additive, i.e. that an intervention has a fixed effect on a barrier, regardless of the number of other interventions affecting that barrier.
Results
HIV infection in MSM in the UK, France, and Poland
The model was calibrated based on ECDC incidence rates and estimated prevalence for an initial year. It can, therefore, be used to assess the prevalence of HIV infection in each country over time. For the UK we found that the HIV-positive MSM population receiving treatment has been steadily increasing over time, whereas the HIV-positive MSM population not receiving treatment remains constant (Figure 2). The prevalence of the undiagnosed HIV-positive MSM population shows a slight increase between 2002 and 2007, and a progressive decline starting in 2008. Together, these results indicate that the prevalence of HIV-positive MSM aware of their serostatus is increasing over time. However, the increase in HIV+ aware MSM precedes the decline in the HIV+ unaware MSM, suggesting there was also an increase in the overall HIV-positive MSM population until 2012.
For France, we see that the prevalence of the HIV-positive MSM population receiving treatment shows a slight increase between 2008 and 2011, and remains constant thereafter (Figure 3). The prevalence of HIV-positive MSM population not receiving treatment remains constant throughout the timeline considered, with a slight decrease between 2008 and 2009. The prevalence of HIV+ unaware MSM population experiences a slight decline between 2008 and 2016. Between the years 2008-2011, the increase in HIV+ aware MSM is greater than the decline in undiagnosed HIV-positive MSM, suggesting an increase in the overall HIV-positive MSM population. However, from 2011 to 2016 the overall population of HIV infection in MSM in France appears to stay constant.
Calibration of the model for Poland shows that the prevalence of diagnosed HIV-positive MSM population not receiving treatment appears constant throughout the years, with a value of approximately 0 (Figure 4). The prevalence of HIV-positive MSM receiving treatment is shown to be progressively decreasing throughout the years. This suggests that the overall prevalence of HIV-positive MSM population aware of their serostatus has been decreasing throughout the years. We also see a decline in the prevalence of undiagnosed HIV-positive MSM from 2010 onwards, which together with the overall prevalence of HIV-positive MSM awareness of their status would suggest the prevalence of HIV infection in Poland among MSM is decreasing. However, the model for Poland was difficult to calibrate, which is appreciated more clearly when using an overlay of the different best-fit curves for the prevalence of HIV infection in Poland. Although we can calibrate the model for Poland to reproduce the observed incidence rates describing the number of MSM that are diagnosed with HIV every year and transition between the unaware HIV+ to the aware HIV+ status, these incidences have very low counts that are not consistent with the prevalence estimates of the MSM in Poland. Given that the data available from ECDC are provided by health authorities in the different countries, we consider the estimates provided by our model to be of value to conduct forward simulations on Poland. Nonetheless, they should be interpreted taking the above into consideration.
Forward simulations of the calibrated model
The model has been calibrated to our three countries (the UK, France, and Poland) and can be used to predict the impact of policy changes on the populations in these countries going forward. As we were focused on strategies to encourage testing in Europe, we have assessed how a change in the testing rate would affect the HIV MSM population in the different countries.
Figure 5 shows the annual incidence of HIV-positive MSM diagnosed prior to the AIDS stage in the UK, France, and Poland when the testing rate is decreased by 50% (testing rate=50%), continued as is (testing rate=100%), increased by 50% (testing rate=150%) or increased by 100% (testing rate=200%) of its calibrated or baseline value in 2020. This is a sudden change to the testing rate, which then remains constant. An increase to 150%, for example, could occur if a new intervention was put in place that had an immediate high impact on the proportion of MSM who get tested. The figures show that a change to the baseline testing rate, be this a reduction (Figure 5A-C) or an increase (Figure 5G-L) in testing rate have a dramatic effect at the moment the change is introduced due to fewer(Figure 5A-C) or more (Figure 5G-L) MSM being tested and therefore fewer of more individuals becoming aware of their status. However, shortly after the change is introduced, the population recovers to values similar to the ones available before the change was introduced.
Figure 6 shows the prevalence of HIV+ unaware MSM and HIV-positive MSM on treatment in the UK, France, and Poland when the testing rate is decreased by 50% (testing rate=50%), continued as is (testing rate=100%), increased by 50% (testing rate=150%) or increased by 100% (testing rate=200%) of its calibrated or baseline value in 2020.
Introducing an increase in the testing rate leads to a decrease in the prevalence of HIV+ unaware MSM in all three countries (Figure 6G-L). However, shortly after this initial decrease in the UK (Figure 6G and Figure 6J), a plateau is reached, suggesting that to maintain a continuous decrease in the prevalence of HIV+ unaware MSM a new intervention must be introduced approximately every 5 years. This plateau is not seen for either France (Figure 6H and Figure 6K) or Poland (Figure 6I and Figure 6L), suggesting an intervention aimed at increasing the testing rate could have more long-term effects in these two countries compared to the UK.
On the contrary, if the testing rate is decreased by half its baseline value (Figure 6A-C) the prevalence of HIV+ unaware MSM increases with no plateau reached within 15 years. This is a result of fewer HIV-positive MSM on treatment which is likely to increase transmission of HIV and with reduced testing rate, the number of newly infected MSM that is not diagnosed will continue to increase.
As expected, based on progress towards the 90-90-90 targets, the prevalence of HIV-positive MSM on treatment in the UK does not vary substantially following an increase in the testing rate (Figure 6G and Figure 6J) as currently 96% of people living with HIV in the UK, although not MSM specifically, that are aware of their status are receiving ART (European Centre for Disease Prevention and Control, 2019). In France, there is a slight and progressive increase of the prevalence of HIV + MSM on treatment following an increase in the testing rate (Figure 6G and Figure 6J) and in Poland the increase is most noticeable (Figure 6I and Figure 6L), aligning with data on people living with HIV aware of their status receiving ART of 91% (European Centre for Disease Prevention and Control, 2019)and 57%(European Centre for Disease Prevention and Control, 2017), respectively.
Figure 7 shows the impact of changes to the testing rate 10 years after the changes have been made (i.e. in 2030). For the UK, the figures show that by 2030, the prevalence of HIV-positive MSM unaware of their status (Figure 7A), the prevalence of HIV-positive MSM on treatment (Figure 7D) and the annual incidence of HIV-positive MSM that get diagnosed prior to the AIDS stage (Figure 7G) will have declined following an increase in the baseline testing rate (testing rate >100%). The prevalence of HIV-positive MSM unaware of their status and the annual incidence of HIV-positive MSM that get diagnosed prior to the AIDS stage increase if the testing rate is reduced, whereas the prevalence of HIV-positive MSM on treatment decreases both if you increase and decrease the testing rate. This decrease following a reduction of the testing rate is likely because, if the testing rate is decreased then fewer people will be aware of their status, and therefore will not be receiving treatment. It is worth noting from Figure 5Cthat the most significant change to the MSM population in the UK occurs immediately after the introduction of the intervention and that by the year 2030 the prevalence and incidence have generally plateaued. The decrease in all populations following an increase in the testing rate is likely to be due to more people being diagnosed and receiving treatment, therefore seeing a reduction in the number of HIV-positive MSM by 2030.
In the case of both France (Figure 7B) and Poland (Figure 7C), the prevalence of HIV-positive MSM unaware of their status declines following an increase in the baseline testing rate (testing rate >100%). However, as opposed to the UK, the incidence of MSM that is diagnosed before the AIDS stage (Figure 7H andFigure7I) and the prevalence of HIV-positive MSM on treatment (Figure 7E and Figure7F) increase following an increase in the baseline testing rate (testing rate >100%). For France, the incidence of MSM that is diagnosed prior to the AIDS stage (Figure 7H) begins to decline following an increase of 50% in the baseline testing rate (testing rate=150%). Similarly, the prevalence of HIV-positive MSM on treatment (Figure 7H) reaches a plateau in following an increase of 50% in the baseline testing rate in France. For Poland, the incidence of MSM that is diagnosed prior to the AIDS stage (Figure 7I) reaches a plateau when the testing rate is doubled (testing rate >200%) and begins to decline only when the testing rate is tripled (testing rate >300%). Additionally, in Poland the prevalence of HIV-positive MSM on treatment (Figure 7F) increases even when the testing rate is four times the current testing rate (testing rate >400%), suggesting there is potentially a large population of undiagnosed HIV-positive MSM that are not receiving treatment.
Table1 shows the percentage change (an increase of decrease) to a given population within the model following an increase in testing rate 10 years after the changes have been made (i.e. in 2030). For all three countries, the prevalence of HIV+ unaware MSM and the incidence of MSM diagnosed at the stage of AIDS would be greatly reduced following an increase in the testing rate. Similarly, an increase in the testing rate would lead to an increase in the incidence of MSM diagnosed prior to the AIDS stage in Poland. However, it would have little effect on the incidence of MSM diagnosed prior to the AIDS stage in France or the UK. This suggests that an increase in the testing rate in Poland would contribute to improved diagnosis of HIV in MSM overall, whereas in France and the UK it would mainly improve early diagnosis of HIV in MSM. Increasing the testing rate of HIV in MSM has almost no effect on the incidence of HIV-positive MSM receiving treatment in the UK, most likely due to the fact that the UK already has 96% of people living with HIV aware of their status receiving treatment. In France, the incidence of HIV-positive MSM receiving treatment is impacted by a factor of 2 following an increase in testing but does not vary after increasing the testing rate beyond double the value for 2020. However, in Poland, the incidence of HIV-positive MSM receiving treatment is nearly doubled after increasing the testing rate by three times the value of 2020. Overall, these results suggest that Poland is the country that would most benefit from increasing the testing rate of HIV, followed by France and the UK.
Achieving maximum testing rates
Results from the survey on the availability of the different interventions to encourage testing of HIV in the different countries and their perceived impact on addressing the different barriers to testing HIV were used to determine the “maximum achievable testing rate” in the different countries based on the interventions that currently exist. For example, if all interventions were available in a country and they were all considered to have a ‘significant’ impact on encouraging MSM to seek testing for HIV, that country would be at its “maximum achievable testing rate”.
Our results show that the UK is very close to the maximum achievable testing rate; it can only improve by 11%. This indicates that the current interventions available in the UK to encourage testing of HIV among MSM are felt to be working as well as they individually can at addressing the barriers to testing HIV in this population, and that to further increase testing for HIV would require the introduction of new interventions. On the contrary, both France and Poland are further away from achieving their maximum testing rate. France could nearly triple its testing rate before reaching its maximum and Poland could increase its testing rate by a factor of 11. This suggests that both countries could benefit from either implementing the identified interventions in the case of Poland (Rodriguez-Rincon et al., [28]) or from improving their impact in the case of France (Rodriguez-Rincon et al., [28]). However, these results are limited by the magnitude of the study in Rodriguez-Rincon et al. [28] as the number of respondents to the survey was very low (UK=8, France=6, Poland=4).
Discussion
This paper describes the calibration of a model for HIV transmission, diagnosis, and treatment of MSM to the European context, specifically for the UK, France, and Poland. We outline how our initial calibrated model for the MSM population can predict the future incidence and prevalence of drug-sensitive HIV in the MSM population in the UK and France; we have also carried out forward simulations for Poland although these should be treated with more caution as the model does not fit the data for Poland as well as for the other countries.
There were a number of challenges encountered in the calibration of the model, specifically related to the availability of data on the prevalence of HIV in MSM for the different compartments of the model. The model for the UK and France revealed that our estimates for prevalence and population estimates for the number of MSM in the year 2002 and year 2011 for HIV+ undiagnosed (i.e. unaware of their HIV+ status) and HIV+ diagnosed (i.e. aware of their HIV+ status), are consistent with the incidence data that we used. However, this was not the case for Poland. For Poland, although we can calibrate the model to reproduce the observed incidence rates describing the number of MSM that are diagnosed with HIV every year, as well as the transition between HIV+ unaware to HIV+ aware, these incidences are not consistent with the prevalence estimates of the MSM in Poland. Essentially, the model tries to fit both the incidence and the prevalence values given an initial condition describing the prevalence of MSM in Poland in 2002. Since this initial condition starts with a high number, the only way to reproduce the low testing rates is to have a build-up of HIV+ undiagnosed MSM over the years. Moreover, the incidence rates are so low that they cannot sustain the estimated levels of the HIV+ aware MSM for 2002. Consequently, we see a decrease in the population of MSM HIV+ aware. For the model calibration of Poland, we used a combination of data from Poland and Romania, due to the fact that although Poland had sufficient cases for modelling, the data were not broken down by CD4 count, which is a requirement of our model. However, we believe the challenges related to the model for Poland are more likely due to an inconsistency between one or more of the following: (i) the model structure (i.e. the model does not contain a factor relevant to Poland), (ii) the model parameter estimates, (iii) the incidence data and (iv) the estimated initial conditions for 2002 and prevalence targets for 2011. Most likely the problem is with either (iii) or (iv) which means either the incidence data are not accurate and contain many missing observations – or the prevalence has been grossly overestimated.
However, given that the data available from ECDC are provided by health authorities in the different countries, we have used the estimates of prevalence provided by our model to conduct forward simulations on Poland.
Despite the challenges, the model developed in this paper can be used to examine the potential impact of different tests and treat policies in Europe going forward. Additionally, as the fit of the model is worse for Poland, this does raise a potential alternative use for the model, namely to identify where prevalence and incidence data do not match and to estimate prevalence data within countries where estimates of prevalence do not exist.
Unsurprisingly, we found that increasing the testing rate led to a decrease in the prevalence of HIV+ unaware MSM in all three countries. However, whereas in France and Poland the effect of the increased testing rate is maintained throughout time, in the UK the sharp increase is followed by a plateau. This indicates that interventions aimed at encouraging testing for HIV in France and Poland are more likely to have long-term effects than in the UK, where a new intervention must be introduced approximately every 5 years in order to further increase the number of HIV-positive MSM aware of their status. The difference in the duration of the effects of an intervention in the UK compared with France and Poland could be due to the fact that, as we found, the UK is close to the maximum achievable testing rate based on current interventions available, whereas in France and Poland interventions could be increased or implemented to achieve the maximum achievable testing rate. It is important to mention that our model focuses on MSM whereas the data available on progress towards the 90-90-90 targets available at a European level consider people living with HIV as an overall population. Therefore, our model may show larger numbers are needed to achieve maximum testing rate than those seen in progress reports, as it takes into consideration the barriers to accessing testing for HIV in MSM and the interventions available in the different countries to overcome these barriers (Rodriguez-Rincon)[28].
To assess the long-term effects of variations in the testing rate, we carried out a forward simulation looking at changes in the different populations in the three countries following the introduction of an intervention in 2020. In the UK, any increase in testing rate beyond double its current value results in a slight decrease in the prevalence of HIV+ unaware MSM but has little impact on the number of HIV-positive MSM on treatment or the annual incidence of HIV-positive MSM in the UK. This is likely because a high enough number of MSM are diagnosed and on treatment which results in a reduction in the overall number of HIV-positive MSM by 2030. These results are in agreement with data available from the 2018 progress report towards achieving the global 90-90-90 targets for the UK, showing that the UK has already achieved the global targets, with 91% of people living with HIV being aware of their status, 96% of those aware of their status receiving ART, and 97% of those receiving treatment having viral suppression [8].
France has achieved the targets for the second and third 90, with 91% of people aware of their HIV status receiving ART and 97% of those receiving treatment being virally suppressed [9]. However, France is yet to achieve the target for people living with HIV to know their status (85% in 2018) [9], which may explain why France could benefit from interventions aimed at increasing the testing rate more than the UK. This is seen in our model where there is a slight increase in the number of HIV-positive MSM on treatment following an increase in the testing rate but a reduction of the annual incidence of HIV-positive MSM.
However, in France the number of HIV-positive MSM on treatment plateaus after the intervention has been increased by 50% its current value, indicating that in France, treatment is readily available once a patient has been diagnosed HIV+, as shown with 91% of people living with HIV aware of their status receiving treatment and 97% of those receiving treatment being virally suppressed [9].
The latest progress data from Poland are from 2015- 2016 and show that Poland is far from achieving the 90-90-90 targets, with data only available on the first and second 90, both at 57% [10]. This is in agreement with our results for Poland that show interventions could be added or improved, as shown through a considerable increase in the number of HIV-positive MSM on treatment and on the annual incidence of HIV-positive MSM following an increase in testing rate. Although the annual incidence of HIV-positive MSM in Poland plateaus after the testing rate has been doubled and in fact declines, once it’s been tripled, the number of HIV-positive MSM on treatment continues to increase even when the testing rate has been quadrupled. This indicates that there is a large population of undiagnosed HIV+ that are not receiving treatment and were they to be diagnosed and on treatment, there would be a reduction in new cases, as shown through a decrease in the prevalence of HIV+ unaware and in the incidence of MSM diagnosed prior to the AIDS stage.
Our model shows that there is variability in the uptake of testing and treatment for HIV in the MSM population across three European countries. However, increasing the testing rate of HIV in MSM contributes to reducing the prevalence of HIV+ unaware MSM in all three countries. Additionally, as is the case for Poland and, to a lesser extent, France, increasing the testing rate leads to an increase in the number of HIV-positive MSM receiving treatment and a reduction in the incidence of MSM that is diagnosed HIV+, suggesting that implementing policies to encourage testing and treating for HIV would be beneficial to the MSM population in Europe. However, deploying any ART-based prevention strategy and associated policies raises a complex array of interdependent issues, including access, cost, impact on behavior and health, implementation, and the possibility of drug resistance developing. All of these need to be considered in future modelling and associated policy analysis work. To provide contextual information to testing for HIV among MSM in the three countries of focus in this study, we conducted a qualitative study on the different barriers to test and treat in France, Poland and the UK, as well as on the interventions in place aimed at encouraging testing (Rodriguez-Rincon [28]).
- Althoff KN, Buchacz K, Hall HI, Zhang J, Hanna DB, Rebeiro P, Brooks JT (2012) U.S. Trends in Antiretroviral Therapy Use, HIV RNA Plasma Viral Loads, and CD4 T-Lymphocyte Cell Counts Among HIV-Infected Persons, 2000 to 2008. Annals of Internal Medicine 157: 325–335.
- (2008) British HIV Association, British Association of Sexual Health and HIV & British Infection Society. UK National Guidelines for HIV Testing.
- Castel AD, Befus M, Willis S, Griffin A, West T, Hader S, et al. (2012) Use of the community viral load as a populationbased biomarker of HIV burden. AIDS (London, England) 26: 345–353.
- (2013) National Council for AIDS and viral hepatitis, & France REcharche Nord & Sud Sida-hiv Hepatites. Management of HIV -Recommendations by group of experts.
- Das M, Chu PL, Santos GM, Scheer S, Vittinghoff E, et al. (2010) Decreases in Community Viral Load Are Accompanied by Reductions in New HIV Infections in San Francisco. PLOS ONE 5: e11068.
- ECDC (Forthcoming) Review of barriers to HIV testing and approaches aimed at increasing the uptake and coverage of HIV testing in the European Union/European Economic Community.
- (2016) European Centre for Disease Prevention and Control. HIV/AIDS surveillance in Europe 2015.
- (2017) European Centre for Disease Prevention and Control. Thematic report: Continuum of HIV care. Monitoring implementation of the Dublin Declaration on Partnership to Fight HIV/AIDS in Europe and Central Asia: 2017 progress report. Stockholm: European Centre for Disease Prevention and Control.
- (2018) European Centre for Disease Prevention and Control (2019) Continuum of HIV care. Monitoring implementation of the Dublin Declaration on Partnership to Fight HIV/ AIDS in Europe and Central Asia: progress report [Special report]. Stockholm: European Centre for Disease Prevention and Control.
- (2017) European Centre for Disease Prevention and Control, & World Health Organization. HIV/AIDS surveillance in Europe.
- Ghys P (2017) AIDS by the Numbers: Where dp we stand with 90-90-90. Presented at the UNAIDS. UNAIDS.
- Granich R, Gupta S, Hersh B, Williams B, Montaner J, Young B, & Zuniga JM (2015) Trends in AIDS Deaths, New Infections, and ART Coverage in the Top 30 Countries with the Highest AIDS Mortality Burden; 1990–2013. PLOS ONE 10: e0131353.
- Granich R M, Gilks CF, Dye C, De Cock KM, & Williams BG (2009) Universal voluntary HIV testing with immediate antiretroviral therapy as a strategy for elimination of HIV transmission: A mathematical model. Lancet (London, England) 373: 48–57.
- Lorente N, Fuertes R, Rocha M, Pichon F, Slaaen Kaye P, Ćosić M, Casabona J (2018) Report on the determinants of HIV test-seeking behaviour among MSM in Europe.
- Morgan Jones M, Pickett J, Chataway J, Swartz J, Yaqub O, Smith P, Manville C (2013) Mapping pathways. Developing evidence-based, people-centred strategies for the use of antiretrovirals as prevention [RR-326-MERCK]. Santa Monica, CA: RAND Corporation.
- Phillips AN, Cambiano V, Nakagawa F, Brown AE, Lampe F, et al. (2013) Increased HIV incidence in men who have sex with men despite high levels of ART-induced viral suppression: analysis of an extensively documented epidemic. PloS One 8: e55312.
- Public Health England (2017a) HIV in the UK: 2016 report.
- Public Health England (2017b) HIV Testing in England: 2017 report.
- Public Health England (2017c) Towards the elimination of HIV transmission, AIDS, and HIV-related deaths in the UK.
- Sood N, Wagner Z, Jaycocks A, Drabo E, & Vardavas R (2013) Test-and-treat in Los Angeles: A mathematical model of the effects of test-and-treat for the population of men who have sex with men in Los Angeles County. Clinical Infectious Diseases: An Official Publication of the Infectious Diseases Society of America 56:1789–1796.
- Sorensen SW, Sansom SL, Brooks JT, Marks G, Begier EM, Buchacz K, et al. (2012) A Mathematical Model of Comprehensive Test-and-Treat Services and HIV Incidence among Men Who Have Sex with Men in the United States. PLOS ONE 7: e29098.
- Szetela B, Lapinski L, & Ankiersztejn-Bartczak M (2014) Principles of HIV testingâ" Recommendations of the Polish AIDS Society
- Tanser F, Bärnighausen T, Grapsa E, Zaidi J, & Newell ML (2013) High coverage of ART associated with a decline in the risk of HIV acquisition in rural KwaZulu-Natal, South Africa. Science (New York, N.Y. 339: 966–971.
- Tao LL, Liu M, Li SM, Liu J, Jiang SL, et al. (2017) Impact of Antiretroviral Therapy on the Spread of Human Immunodeficiency Virus in Chaoyang District, Beijing, China: Using the Asian Epidemic Model. Chinese Medical Journal 130: 32–38.
- Vasylyeva TI, Liulchuk M, Friedman SR, Sazonova I, Faria NR, et al. (2018) Molecular epidemiology reveals the role of war in the spread of HIV in Ukraine. Proceedings of the National Academy of Sciences of the United States of America 115: 1051–1056.
- World Health Organization (2016) Consolidated guidelines on the use of antiretroviral drugs for treating and preventing HIV infection. Recommendations for a public health approach -Second edition.
- World Health Organization (n.d.) N.d. HIV/AIDS.
- Rodriguez-Rincon D, Hocking L, Parks S, Amato-Gauci AJ, Semanza JC (2020) Barriers for the MSM Population to Access Testing for HIV in France, Poland, the UK and Across Europe: a Qualitative Study. J HIV AIDS Infect Dis 6: 1-27.
- Vardavas R, Parks S, Rodriguez-Rincon D, Syme J, Hocking L, Ghiga I, Morgan-Jones, M, Amato-Gauci AJ, Semenza JC (2020) Modelling test and treat strategies for HIV in men who have sex with men in the UK, France and Poland. J HIV AIDS Infect Dis.
FIGURE 1
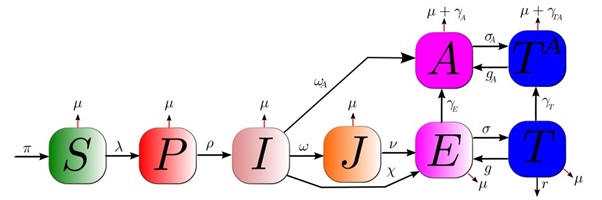
Figure 1: Model Structure
FIGURE 2
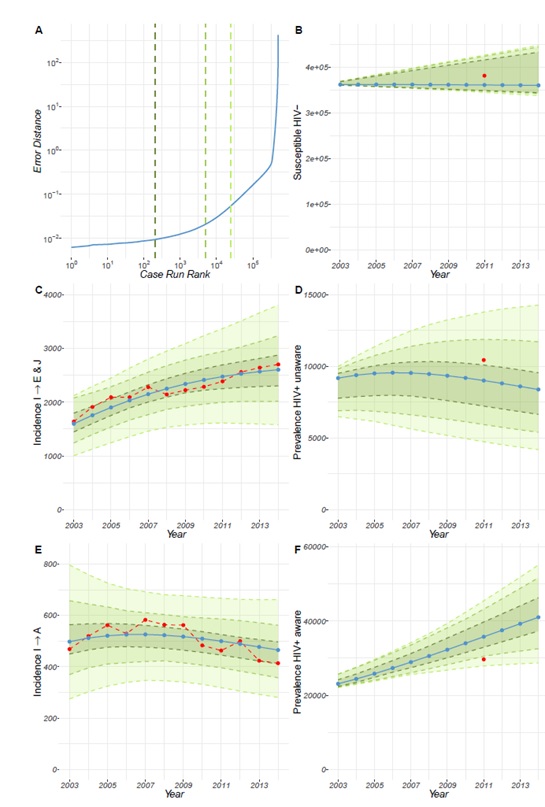
Figure 2:Model calibration for the HIV MSM population in the United Kingdom. Plot (A)shows on the x-axis the case runs arranged in order from the case run that produces the lowest calibration error compared to the observed data to the largest. On the y-axis, we show the overall error distance. Plots (B), (D), and (F) are for the dynamics of the prevalence of the MSM HIV-, HIV+ aware and the HIV+ unaware. Plots (C) and (E), respectively show the dynamics of incidence of diagnosed HIV infection among MSM in either the E or J state and the A state. In all plots, the blue trajectory shows results from the best case run of the model, the red point shows the calibration target and the green ribbons or envelopes going from the darker inner ones to the outer lighter ones show the range of cases that belong to the top (i.e. best) 0.2%, 1% and 10% of the case runs. These ribbons do not show trajectories but rather help show that the top trajectories are bounded to lie within these regions. Notice the range shown by the green ribbons for the year 2002, illustrates the effect of having sampled the initial prevalence conditions.
FIGURE 3
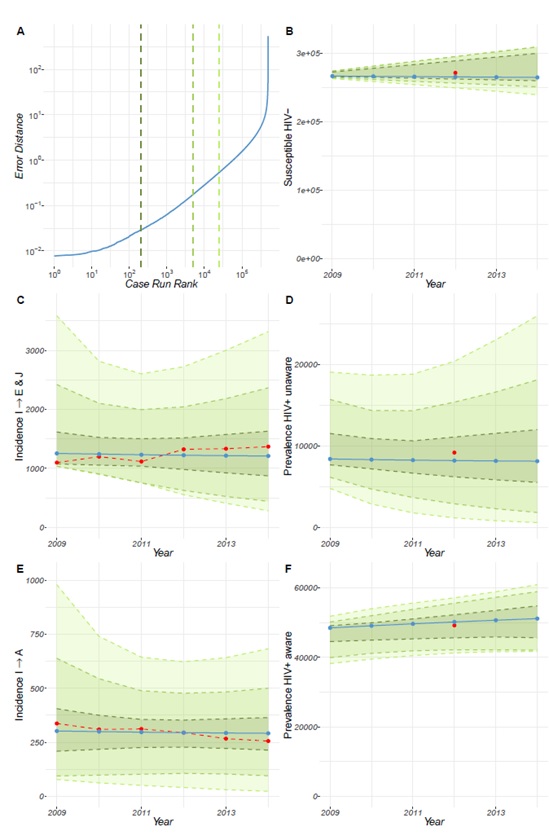
Figure 3: Model calibration for the HIV MSM population in France Plot (A) shows on the x-axis the case runs arranged in order from the case run that produces the lowest calibration error compared to the observed realists to the largest. On the y-axis, we show the overall error distance. Plots (B), (D), and (F) for the dynamics of the prevalence of the MSM HIV-, HIV+ aware, and the HIV+ unaware. Plots (C) and (E) respectively show the dynamics of the incidence of diagnosed HIV infection among MSM in either the E or J state and the A state. In all plots, the blue trajectory shows results from the best case run of the model, the red point shows the calibration target and the green ribbons or envelopes going from the darker inner ones to the outer lighter ones show the range of cases that belong to the top (i.e. best) 0.2%, 1% and 10% of the case runs. These ribbons do not show trajectories but rather help show that the top trajectories are bounded to lie within these regions. Notice the range shown by the green ribbons for the year 2002, illustrates the effect of having sampled the initial prevalence conditions.
FIGURE 4
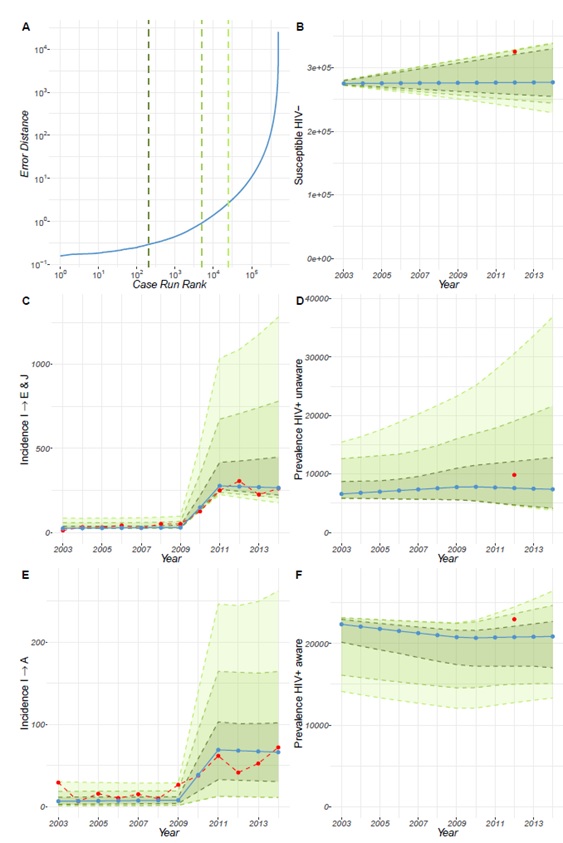
Model calibration fo the HIV MSM population in Poland Plot (A) shows on the x-axis the case runs arranged in order from the case run that produces the lowest calibration error compared to the observed realists to the largest. On the y-axis, we show the overall error distance. Plots (B), (D), and (F) for the dynamics of the prevalence of the MSM HIV-, HIV+ aware, and the HIV+ unaware. Plots (C) and (E) respectively show the dynamics of the incidence of diagnosed HIV infection among MSM in either the E or J state and the A state. In all plots, the blue trajectory shows results from the best case run of the model, the red point shows the calibration target and the green ribbons or envelopes going from the darker inner ones to the outer lighter ones show the range of cases that belong to the top (i.e. best) 0.2%, 1% and 10% of the case runs. These ribbons do not show trajectories but rather help show that the top trajectories are bounded to lie within these regions. Notice the range shown by the green ribbons for the year 2002, illustrates the effect of having sampled the initial prevalence conditions
FIGURE 5
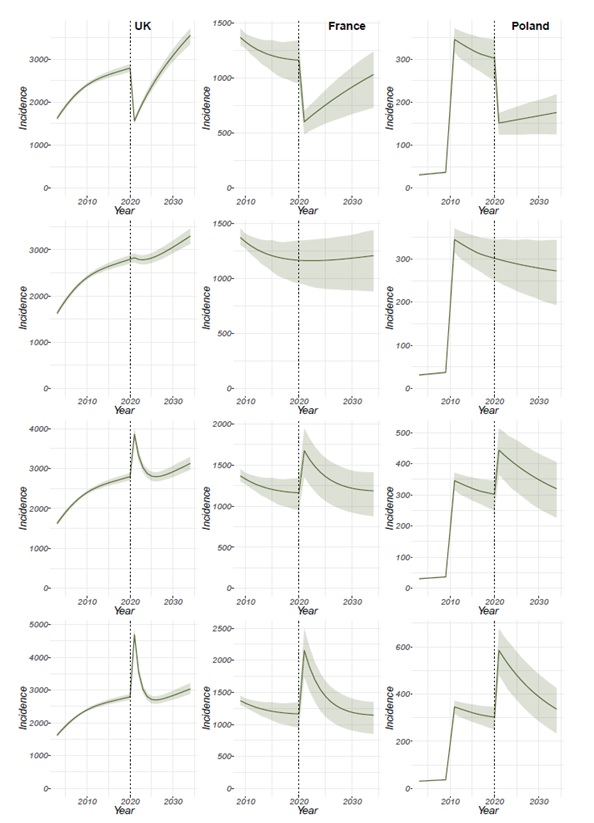
Figure 5: Incidence of HIV-positive MSM individuals who are diagnosed prior to the AIDS stage following a change in testing rate in the year 2020 of (A-C) 50%, (D-F) no change, (G-I) 150% and (J-L) 200%. Results for the UK (right), France (center), and Poland (left) are respectively shown along the different columns. The lines show the median trajectory of 200 calibrated case runs. The bands around the medians show the inter-quartile ranges across the set of calibrated cases.
FIGURE 6
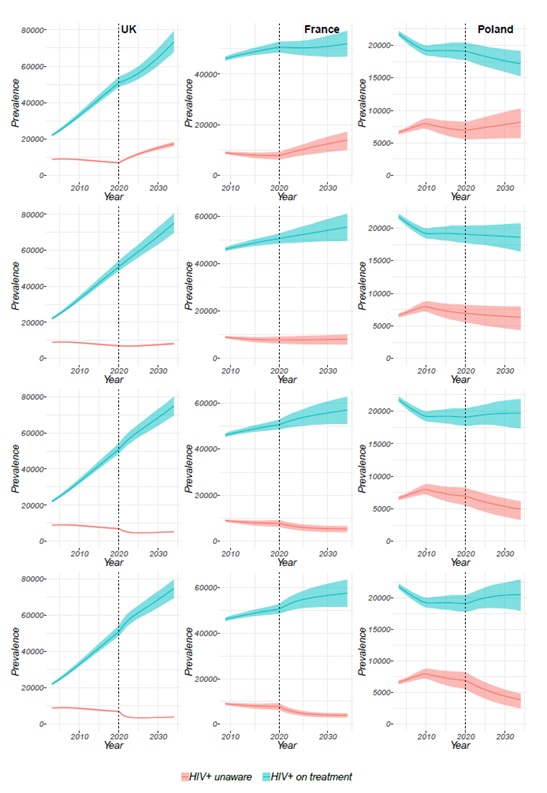
Figure 6:Prevalence of HIV+ unaware MSM (red line) and HIV-POSITIVE MSM on treatment (blue line) following a change in testing rate in the year 2020 of (A-C) 50%, (D-F) no change, (G-I) 150% and (J-L) 200%. Results for the UK (right), France (center), and Poland (left) are respectively shown along with the different columns. The lines show the median trajectory of 200 calibrated case runs. The bands around the medians show the inter-quartile ranges across the set of calibrated cases.
FIGURE 7
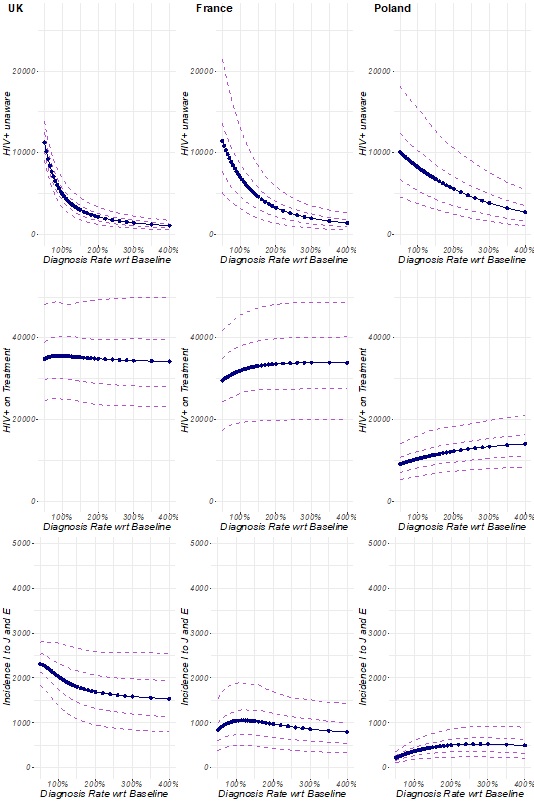
Figure 7: Changes to the prevalence of the HIV unaware MSM population (A-C), the number of HIV-POSITIVE MSM on treatment (D-F), an annual incidence of HIV-POSITIVE MSM that gets diagnosed (G-I) for the year 2030 following different increases in diagnosis rate. Results for the UK (right), France (centre), and Poland (left) are respectively shown along with the different columns. The lines show the median trajectory of 200 calibrated case runs. The band shows the inter-quartile range and the out-band spans the 5 to the 95th percentile.
Tables at a glance