Modification of Polyethylene-Based Cable Insulation Material
Received Date: July 28, 2020 Accepted Date: August 24, 2020 Published Date:August 26, 2020
doi: 10.17303/jmsa.2020.4.203
Citation:M. E L-Muraikhi (2020) Modification of Polyethylene-Based Cable Insulation Material. J Mater sci Appl 4: 1-14.
Abstract
The effect of an applied dc electric field (EF) on the frequency variation of the dielectric dispersion of low-density polyethylene (LDPE), grade LA071 was investigated over the frequency range of 500Hzto 40MHz at room temperature. The dielectric dispersion data were used to improve the performance of this type of LDPE in cable jacketing. The variations in the dielectric constant ε’, dielectric loss factor ε′′, tan δ, and a.c. electrical conductivity σ(ω) with frequency was observed to be strongly dependent on the variation in the dc electric field. The results demonstrate that the dielectric constant ε’ and loss factor ε” vary nonlinearly with the applied field (EF). Herein, the observed relaxation effects are described by the Clausius-Mossotti Debye relation using a set of relaxation times and a possible reason for dipole relaxation is discussed. The change in the polymer’s crystallinity due to the electric field can be attributed to the induced bond scission and subsequent cross linking.
The variation in the ac conductivity with frequency obeys the Jonscher power law n σ (ω) = σ dc + Aω at high frequencies, whereas the dispersion at lower frequencies confirms the presence of an electrode polarization effect. An increase in the dc electric field resulted in a significant decrease in the ac conductivity, and simultaneously reduced the relaxation time. This finding may be caused by the hopping of electrons under the effects of the applied electric field. The results have been interpreted in terms of electronic conduction.
Keywords: Dielectric constant; Dissipation Factor; Polyethylene; Power Loss; Tan δ; ac conductivityσ ac .
Introduction
Polyethylene (PE) is widely used as an electrical insulation material because of its low dielectric loss and superior breakdown strength [1-4]. The dielectric loss of PE is low because its dipolar orientation polarization is small. By using an extremely clean material, an extremely clean environment and a dry cross linking method, the field concentration caused by impurities and micro voids in the LDPE material used to insulate an extra high power cable can be significantly reduced, thus providing a way to improve the stability of LDPE in scientific instruments.
A nonlinear dielectric, i.e., a material that undergoes changes in its conductivity and/or dielectric constant in response to an electric field, can be very useful in the design of high voltage systems such as cable joints and terminations. In the extreme case of highly nonlinear materials such as LDPE, the materials can be thought of as dielectrics (often with a large dielectric constant) below a certain field and near-perfect conductors above it. Thus, due to this transition, such materials limit the maximum field within them. As the voltage of such systems is increased, the electric field “penetrates” into the grading system while limiting the maximum field that can occur within the system. This limitation of the electric field also contributes to defect tolerance, because the field around a defect is also limited [5,6].
The a.c. electrical properties of polymers are thus commonly and conveniently expressed in the form of the relative permittivity and loss tangent as a function of frequency. One of the main advantages of frequency-dependent measurements is that the contributions of bulk material, grain boundaries, and electrode effects can easily be represented if the time constants are sufficiently different [7] to allow separation. In addition, dielectric relaxation, which is due to many different polarization mechanisms, is observed under an ac. field. The presence of any dielectric relaxation thus corresponds to one or more of the possible polarization mechanisms that occur on a microscopic scale. Each relaxation process may be characterized by a relaxation time that describes the decay of its polarization over time in a periodic field. Therefore, ac. electrical studies of polymers reveal structural details and offer valuable complementary information relevant to electrical applications of polymer materials. However, certain dielectric quantities or functions are employed more often than others depending on the desired application.
The additives used in the manufacture of low-density polyethylene (LDPE) cable jackets and the compatibility between these additives affect the properties of cables insulated by such jackets [8-11].
Electric field analysis, field optimization and field measurement techniques have been introduced to evaluate the performance of devices used in applications characterized by the high electric field stress induced by power equipment systems and thereby create devices with higher insulation performance, lower losses, lower environmental impact and higher reliability [12]. In general, the variation of dielectric constant with frequency suggests the presence of higher space charge polarizability of the material in the low-frequency region. The electronic exchange of the number of ions in the polymeric confirmation gives the local displacement of electrons in the direction of the applied field, which produces the polarization. As the frequency increases, a point is reached where the space charge cannot sustain and comply with the external field. Therefore, the polarization decreases and exhibits the reduction in the value of dielectric constant as the frequency increases.
The present work aimed to study the effect of an applied dc field on the dielectric properties of polyethylene LDPE, grade LA071 used in insulating cables. ac. impedance data were used to determine the dielectric constant, loss factor, and the relaxation processes that may be induced by the dc electric field and frequency range used.
Experimental Techniques
Sample Preparation
The material used in this work was low-density polyethylene LA071 produced by Qatar Petrochemical Company (QAPCO). The polymer has a melt flow index of 7.0, a crystalline melting temperature of 108°C, and a density at 23°C of0.918 g/cm3 . The LDPE was fabricated into thin sheets measuring 50µmin thickness.
Dielectric Measurements
Samples were cut into square pieces, coated with a silver paste to create ohmic contacts, and placed in a two electrode-type sample holder. The exposed area was 1.368 cm2 . Measurements of the dielectric constant ( ε’ ), dielectric loss factor ( ε’’ ), and loss tangent tan (δ)were performed in the air over a frequency range of 0.5kHz - 40MHz and, at 0.8Vusing a HIOKI 3532 LCR tester at room temperature. The measurements were repeated over the same frequency range before and after the samples were subjected to external dc electric field ranging from 0 to 105 V cm-1. The dc electric fields were applied perpendicularly to the sample layer. The magnitude of the field used did not exceed 105 V cm-1to avoid any perturbation in the bulk of the polymer samples.
The complex permittivity ∗ ε consists of real and imaginary parts:
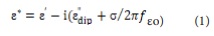
where ∗ ε is the permittivity i = −1 , dip ε" is the loss due to dipolar reorientation, f is the ionic conductivity, f is the frequency and ο ε is the permittivity of free space(= 8.85 × F/m). The real component represents the dielectric constant, whereas the imaginary component represents the loss factor. The dielectric parameters (ε’) and (ε’’) and the electrical conductivity (σ) were evaluated using the conventional formula discussed in [13,14]. These formulas are:
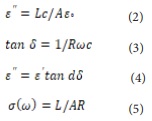
where ω is the circular frequency, and L and Aare the thickness and cross-sectional area of the samples, respectively. Loss tangent (δ) data were obtained directly from the measurement bridge, from which (ε’) and (ε’’) were calculated using Eqs.2 and 4.These results, were then substituted into Debye’s equation [15-17], where is the dielectric constant in a static field, is the dielectric constant at the upper limit of the frequency range (minimum value of ε’) and τis the relaxation time.
Debye’s equation can be modified to yield the dielectric parameters in the form of a linear equation
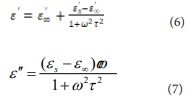
The experimental results confirm the validity of the equation for LDPE, grade LA071 and it is to be noted that at higher frequencies ( 100 kHz) the values of become constant
By simple mathematical manipulation, one can get the dielectric parameters in the form of the equation representing a straight line, namely
Equation (7¯) is more useful for the higher frequencies it can be written as
Eq.8 is more useful for higher frequencies [18]. The relaxation time can be calculated from the intercept of the linear equation.
Results and Discussion
Complex dielectric function spectra
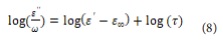
The dielectric properties of LDPE, grade LA071 were demonstrated to be dependent on the applied electric field. The results regarding the permittivity and loss tangent of unprocessed LDPE, grade LA071 are presented in Figure 1 (a, b and c). The real part of the dielectric permittivity is plotted versus the applied frequency for various electric fields, revealing the frequency-dependent permittivity (ε′) of LDPE grade LA071 at room temperature. The curve of ε′exhibits an exponential decrease with frequency and the broadness of the curve suggests that the relaxation is induced by many basic processes based on the distribution of activation energies and relaxation times. These processes arise from the polymer’s interaction with the electric field. Different types of charge carriers are generally found in polymers and contribute to polarization in different ways, depending on their interaction with an applied electric field. The collective contribution of different charge carriers to polarization produces a polarization peak. Accordingly, dielectric relaxation, which is due to many polarization mechanisms, is observed under a field. Relaxation is caused by the segmental rotation of the polymer chains, relaxation of the space charge, or rotation of entire molecules. The movement of such carriers is achieved at relatively high activation energies. Therefore, their contribution to polarization will appear only at high electric fields (V=104 V cm-1).
Figure1b shows three response frequency bands for the LDPE grade LA071 samples. Overall electric field values in the first frequency band(1-10kHz), (ε′) sharply decrease as the frequency increases. In the second band (10kHz-1MHz), (ε′) relaxation broadness appears to be caused by the main relaxation process. In the third frequency band (1MHz-4 MHz) (ε′) slightly decreases with frequency, which is attributed to dielectric dispersion
However, overall frequency ranges, significant changes are observed in the dielectric response of LDPE grade LA071 after applying an electric field, such as the increase in (ε′) with th strength of the applied electric field (0.5-100kV cm-1) shown in Figure 1b.
Referring again to Figure 1 (a&b), the dependence of ε′on the electric field is much weaker for f > 1MHz. Note the dramatic increase in the permittivity as the frequency decreases below~10kHz-1kHz.This behavior results from the ionic conductivity of the material. The very rapid increase in ε′ with decreasing frequency is associated with the effect of space charge polarization in the bulk material, structural defects, and electrode effects [19, 20]. For metallic electrodes, a strong electric field at the interfaces may arise from the difference in the work functions of the metal and the electron affinity of the material. These effects are negligible at higher frequencies.
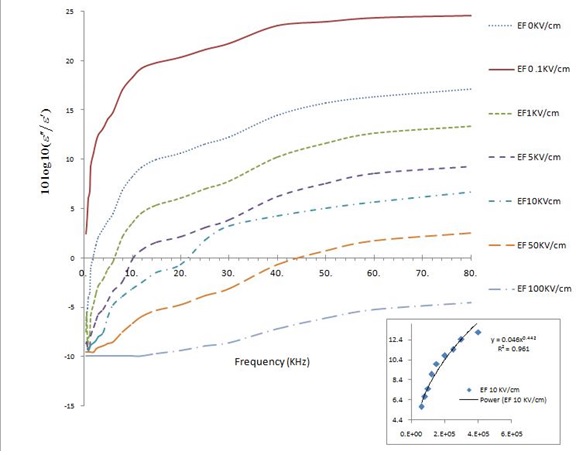
Figure 1c shows the variation in the dielectric loss factor (ε′′) with frequency at different electric field values for LDPE grade LA071 samples which demonstrates that relaxation processes occur. It is interesting to note that, the increase in the electric field reduces the intensity of these relaxation processes and causes them to shift concerning the relaxation time. Figure 1c reveals rapid decreases in the (ε′′) dielectric loss factor in the frequency range (1kHz-1MHz) for the LDPE grade LA071 samples over the wide bandwidth, which is attributed to Debye dielectric relaxation, caused by dipole rotations resulting from movements of the main polymer backbone.
Furthermore, low-intensity activated phenomena were observed at low frequencies (1-10kHz) in the LDPE grade LA071 samples due to the local motion of parts of the polymer backbone which is consistent with the observations of Mary C Wintersgill, et al. [21]. Meanwhile, the large peak observed at (10-100 kHz) was caused by heat distortion [22, 23]. In all of the samples, the dielectric loss (ε′′) was also observed to decrease with the increase in the electric field due to the perturbation of the phonon system by the electric field; indeed, the energy transferred to the phonons dissipated in the form of heat.
Figure 1 illustrates another interesting loss characteristic that is yet unaccounted for concerning the increase in the electric field effect. The LDPE grade LA071 polymers tend to have a lower loss than their unprocessed counterparts. This lower loss is beneficial because the increase in the electric field that causes the dielectric constant to increase also causes the loss to decrease considerably. Moreover, the modest increase in permittivity and the significant concomitant decrease in the loss tangent of the LDPE grade LA071 polymers due to the applied electric field suggests that the electric field may help induce the dielectric dispersion of the polymers.
The plots of ε′ versus ε′ yield Cole-Cole semicircles for modified LDPE grade LA071 at room temperature (Figure 2a). All of the plots exhibit the usual characteristics indicative of polymer electrolysis, consisting of a skewed semicircle with a tilted tail at the end. The Cole-Cole plots indicate that the material is dominated by complex polarization mechanisms with different relaxation times. The unprocessed LDPE grade LA071samples also exhibit distorted arcs with comparatively large values of ε′′ and ε′, as demonstrated in the inset of Figure 2a. However, it is also clear that the ratio (ε′′/ε′) at high frequency is roughly constant (see Figure2b), which is in agreement with the universal dielectric response (the Kramers-Kronig relation) [24].
The relaxation times obtained using Eq.8are listed in Table 1. Figure 3 shows a plot of log( ) ∞ ε ′ − ε ′ versuslog(ε ′′ ω) for an LDPE grade LA071 sample, the value of the main relaxation time τ was obtained using a linear fitting equation.
Loss Data
Figure 4 shows the variation in the loss tangent (tanδ ) with the electric field (kV cm-1). This figure indicates that the loss tangent behavior in the low-frequency range is appreciable, and relaxation peaks are observed. Figure 4a illustrates the increase in tan delta with the electric field strength up to10kV cm1 at which point tan delta remains nearly constant. This behavior indicates that these samples can be used as dielectric materials in capacitors. Figure 4b shows a significant decrease in tan delta in the high- frequency range of 0.5kHz to 40 MHz for the samples considered, tan rapidly decreases as the frequency increases under a constant electric field as shown in Figure 4c.
Figure 4c clearly shows that the value of tan plays increasingly dominant role in determining the electrical loss of the samples as the frequencies approach the megahertz region (40 MHz). We note that the values of tan decrease at lower frequencies but still have a significant impact on the electrical loss of the samples. We used various fitting functions to evaluate the functional dependence of the dielectric loss on the input frequency. The data points, fit in Excel, showed an excellent fit to a power-law distribution, as demonstrated in Figure 5. As illustrated in Figure 5 and Table 2, the losses appear to vary with the α power of frequency, where 0.14 ≤ α ≤ 0.54 .
The basis of this dependence was described by (R. F. Eaton & C. J. Kmiec) [25], with the skin effect varying with the square root of the applied frequency. The depth of penetration of electromagnetic waves is frequency-dependent. Thus, it can be determined that the electrical loss dependence on the square root of frequency is due to the skin effect. (R. F. Eaton & C. J. Kmiec) [25] expect losses in coaxial cables to also vary with the values of the tan delta because tan delta represents electrical dissipative mechanisms within the polymer which are often caused by the molecular motions of polar groups either attached to or dissolved in polymer chains. Usually, both electrically and mechanically induced tangent delta peaks can be observed for a given molecular motion; if the polymer does not contain polar groups, the electrical loss induced by the motion may not be observed. The effect of polar groups on electrical losses in polyethylene has been reported by Sato in [26], in which the focus was on the dependence of tan δ on the presence of polar groups within polyethylene. Next, we will discuss the modeling of the quantitative dependence of cable loss on tanδ.
The samples that were affected by the electric field strength of (5x10⁴ V/cm and 104 V/cm) exhibited the lowest losses, and the samples affected by an electric field strength of103 V/cm showed lower losses than those affected by electric fields strengths of 102 V/cm or 0V/cm. Therefore, the samples that were subjected to a more intensedc electric field effect showed lower losses.
Quantitative Modulation Dependence of Cable Loss on tan δ
The two critical properties of polyethylene resins used for cable insulation are a low dielectric constant and a low dissipation factor. The dielectric constant (DC) is a function of crystallinity or density and increases as density increases. The dissipation factor (DF) represents signal loss due to dissipation through insulation. Dipolar impurities, end groups, chain folds, and branch points cause the DF to increase, as does increase the measurement frequency. With the increased need for data and signal transmission in today's world, test frequencies can reach upwards of several megahertz. Figure 6 (a,b,c&d) shows the DC and DF values of HDPE grade LA071 materials used in applications today. We have established that there exists a direct relationship between the frequency (MHz), DC dielectric constant, (DF) dissipation factor, and electric field strength, which can be exploited to optimize the frequency regions over which LDPE grade LA071 can be used to insulate conductive cables. In Figure7, the resolution of Figure 6 (a, b, c, &d) is expanded toward the megahertz region.
• Simply increasing the electric field strength would provide greater insulation by shifting to a high frequency. • If the frequency is substantially higher than that shown in Figure7, the material will be capacitively graded, whereas if the frequency is substantially less than that shown, the system will be resistively graded. • Figure 7 suggests that effective measurement frequency must increase substantially with increasing electric field strength.
AC Conductivity Spectra
Figure 8 plots the variation in the ac conductivity σ ac with frequency for different electric fields at room temperature for LDPE grade A071. The ac conductivityσ ac patterns show a frequency-independent plateau in the low-frequency region and dispersion at higher frequencies. This behavior obeys the Jonscher [24, 27] power law n σ (ω) = σ 0 + Aω (the solid line is the fit to the expression), whereσ 0 is the dc conductivity (frequency-independent plateau in the low-frequency region), A is a pre-exponential factor and n is a fractional exponent between 0 and 1. Regarding the electric field effect, the conductivity spec trum is reduced as the field strength increases. The small deviation fromσdc (plateau region) in the low-frequency region of the conductivity spectra is evidence of the electrode polarization effect for these materials, whereas the small dispersion in the high-frequency region of the σ spectra is due to the contribution of segmental motion in LDPE. The values ofσo , A and n were obtained by fitting σ (ω) n σ (ω) = σ 0 + Aω to and are tabulated in Table 3. Generally, for ionic conductors, the power-law exponents (n) may lie between 1 and 0.5, representing ideal long-range pathways and diffusion-limited hopping (tortuous pathway), respectively [28]. The values of the exponent for the higher frequency slopes of these materials fall within the range of0.887 to 0.866. (Table 3), demonstrating that the longrange drift of ions may be one of the sources of ion conduction. Table3, clearly shows that the dc conductivityσdc (σo ) decreases with increasing electric field. The overall behavior of σ ac follows the universal dynamic response [24], which has been widely observed in disordered materials such as ionically conducting glasses, [29] conducting polymers, and doped crystalline solids [30,31] and is generally believed to be reflected in the charge transport behavior of charge carriers.
The variation in conductivity with the electric field at various frequencies for samples of LDPE grade A071was studied systematically. Figure 9 demonstrates a sharp decrease in conductivity with electric field strength. Furthermore, a slight decrease in conductivity is shown in the MHz frequency range. The decrease in conductivity due to electric field effects may be attributed to the scissoring of polymer chains, resulting in a decrease in the free radical concentration, saturation, etc.
Figure8 clearly demonstrates that Mott [32] variable range hopping explains the conduction behavior observed in disordered and amorphous materials. In the variable hopping model, it is assumed that carriers are quasi-free in the sense that their localization length is sufficiently long and electron-phonon coupling sufficiently small to form polarons that trap charge carriers in their phonon clouds. This suggests that the number of mobile particles that can be polarized by an electric field is reduced by trapping. Applying a strong electric field [33]to the materials explored in this study leads to a non-equilibrium state. As a consequence, bond lengths are altered and most physical properties are affected.
Conclusions
LDPE grade LA071 films were subjected to electric fields to study the effects of these fields on the dielectric properties of the films, our experimental results regarding the electrical properties of LDPE gradeLA071 samples demonstrate that the samples’ sensitivity to electric field effects varies, meaning that these polymers exhibit much more effective insulation when they have been subjected to an electric field. Therefore, we suggest that LDPE grade LA071 be used in the manufacture of cable jackets. In this study, it was observed that under an electric field effect, the dielectric loss of LDPE gradeLA071decreases with frequency, whereas the dielectric constant exhibits random behavior, decreasing up to 500 Hz and then the dependence of ε′ on the electric field is much weaker for f > 1MHz.
We have established that there exists a direct relationship between frequency (in the MHz range), dielectric losses (DF), dielectric constant (DC) and electric field strength that can be used to optimize the range of frequency over which LDPE grade LA071 can be used as a jacket to insulate conductive cables.
- M Rao Rama, D Roy, JKD Verma J (1998) Materials Sci., 23:2995.
- Li Lunzhi, Lisheng Zhong, Kai Zhang, Jinghui Gao, (2018) Temperature Dependence of Mechanical, Electrical Properties, and Crystal Structure of Polyethylene Blends for Cable Insulation. Materials (Basel)., 11: 1922.
- CD Green, AS Vaughan, GC Stevens, SJ Sutton, T Geussens, MJ Fairhurst (2013) Recyclable power cable comprising a blend of slow-crystallized polyethylene. IEEE Transactions on Dielectrics and Electrical Insulation, 20.
- Y Zhou, S Peng, J Hu, J He (2017) Polymeric insulation materials for HVDC cables: Development, challenges, and future perspective. IEEE Transactions on Dielectrics and Electrical Insulation 24: 1308-1318.
- SA Boggs, and JY Zhou (2000) "Dielectric Property Measurement of Nonlinear Grading Materials". Annual Report of the IEEE Conference on Electrical Insulation and Dielectric Phenomena764-767
- J Y Zhou, and SA Boggs (2001) "Measurement of Nonlinear Dielectric Properties – Effects of Dielectric Dispersion". IEEE Conference on Electrical Insulation and Dielectric Phenomena 1-4.
- R Gerhardt (1994) J Phys. Chem. Solids.55: 1491.
- K Tohyama, M Nagdo and M Kosaki (1991) proceeding of the 3rdInterational Conference on Properties and Applications of Dielectric Materials. Tokyo, Japan 8-12: 1200.
- G Mazzantia, GC Montanari, F Palmieriand, J Alison (2003) Apparenttrap-controlled mobil ity evaluation in insulating polymers through depolarization characteristics derived by space charge measurements. J.Appl. Phys 94: 5997–6004
- Yu Guang, Cheng Yujia, Zhang Xiaohong (2019) The Dielectric Properties Improvement of Cable insulation Layer by Different Morphology Nanoparticles Doping into LDPE. Coatings 9 204: 1-14.
- X Huang, L Xie, K Yang, C Wu, P.Jiang, S.Li, et al. (2014) Role of interface in highly filled epoxy/BaTiO3 nano composites. PartI-correlation between nanoparticle surface chemistry and nanocomposite dielectric property. IEEE Trans. Dilectr. Electr. Insul 21: 467–479.
- H. Okubo, "Enhancement of electrical insulation performance in power equipment based on dielectric material properties" Dielectric and Electrical Insulation, IEEE Transaction on, Issue3 19 (2012) Annual Report of the IEEE Conference on Electrical Insulation and Dielectric Phenomena. 733-754.
- S. R. Elliott (1987) A.c. conduction in amorphous chalcogenide and pnictide semiconductors. Advance in Physics 36: 135-217.
- V K Bhatnagar, and KL Bhatia (1990) Frequency-dependent electrical transport in bismuth-modified amorphous germanium sulfide semiconductors. Journal of Non-Crystalline Solids 119: 214-231.
- P Debye (1929) Polar Molecules, Chemical Catalog, New York
- KS Cole and RH Cole (1949) Dispersion and Absorption in Dielectrics 1 Alternating Current Characteristics J. Chem. Phys. 9: 341.
- RH Cole and DW Davidson (1952) J. Chem. Phys. 20:1389.
- R Pethig (1979) Dielectric and Electronic Properties of Biological Materials. Wiley, New York 15-18.
- AK Kroschwitz (1988) Electrical and Electronic Properties of Polymers: Encyclopedia Reprint Series. Wiley, New York 58.
- Chen Vaughan, Hao Miao, Xu Zhiqiang. Alum Vaughan, Cao Junzheng, and Wang Haitian (2015) CSEE JOURNAL OF POWER AND ENERGY SYSTEMS, Vol 1, NO. 2 june 9-21.
- MC Wintersgill, and JJ Fontanella (1998) Electro chimica Acta, 43 1533-1538.
- AH El-Sayed, HA Abd El-Rehim, N. A. Khalifa, and A.ElHag Ali (1999) Radiation Physics and Chemistry 55: 219-229.
- SM Abdou, and RI Mohamed (2002) Journal of Physics and Chemistry of Solids 63: 393-398.
- AK Jonscher (1983) in “Dielectric Relaxation in Solid” Chelsed Press 80.
- RF Eaton and CJ Kmiec (2008) International Wire & Cable Symposium, Proceedings of the 57th IWCS 12: 515-520.
- Y Sato, et al.(1978) J. Appl. Polym. Sci., 22: 2141-2153,
- AK Jonscher (1977) Nature 267: 673.
- K A Mauritz (1989) Macromolecules 22: 4483.
- SR Elliott (1988) Solid State Ionics 27: 131.
- C leon, ML Lucia, and J. Santamaria (1997) Phys. Rev. B 55: 882.
- C leon, ML Lucia, and J Santamaria, MA Parsi, Sanz AJ and Varez (1996) Phys. Rev. B54 184.
- NF Mott and EA Davis (2012) “Electronic Processes in No crystalline Matter”, Clarendone, (2 edn)Oxford University Press, USA.
- A Bising, G Gambarimi and I Zeppd, Nuova Cimento (1983) 20: 1465.
FIGURE 1
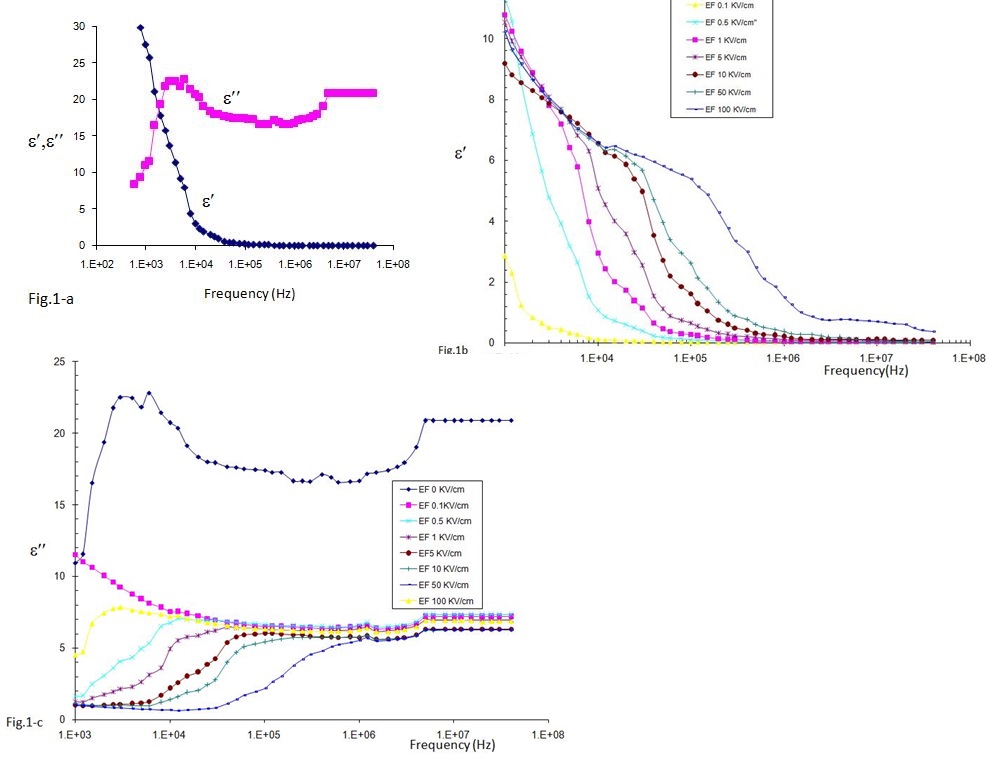
Figure 1: 1-a The frequency dependence of the permittivity and the imaginary part of unprocessed LDPEgrade LA071.
The frequency dependence of the real part of the complex permittivity of LDPE grade LA071 under various electric fields.
.The frequency dependence of the imaginary part of the complex permittivity of LDPE grade LA071 under various electric fields.
FIGURE 2
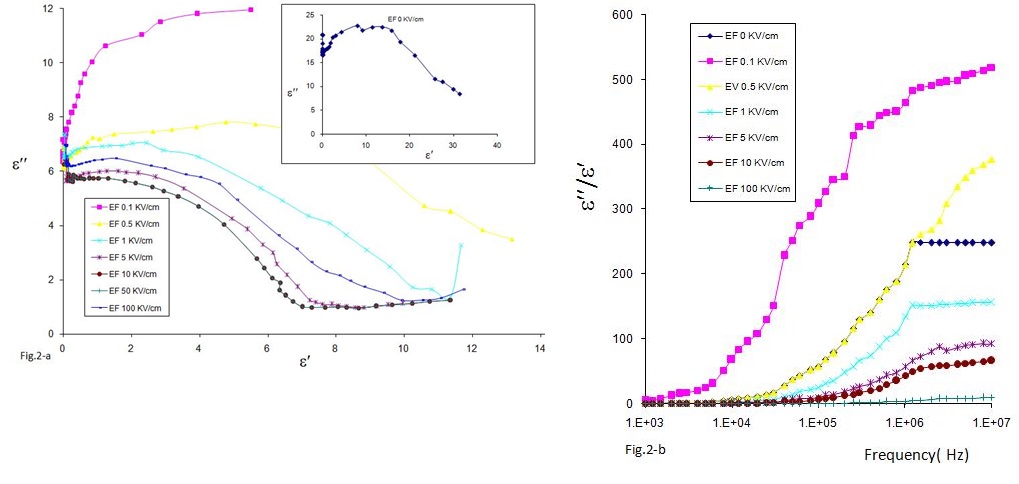
Figure 2: Cole-Cole plots of () versus () for modified LDPE under different electric fields at room temperature. The inset presents a distorted arc for unprocessed LDPE grade LA071.
Frequency variation of the ratio (/)for modified LDPE grade LA071samples under different electric fields.
FIGURE 3
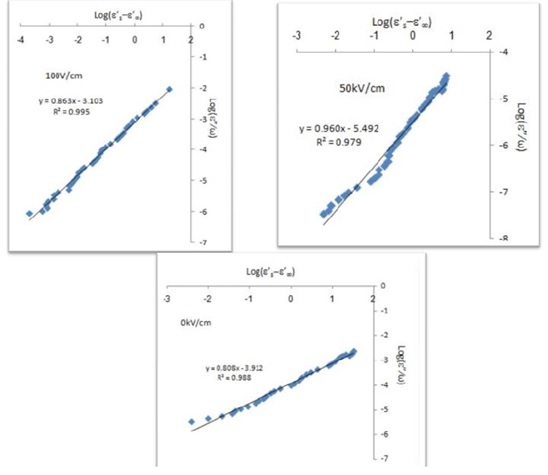
Figure 3: The plot of log ( - ) versus log (/ω) for LDPE grade LA071samples under electric fields (of 0 V/cm, 102 V/cm and 50×103 V/cm).
FIGURE 4
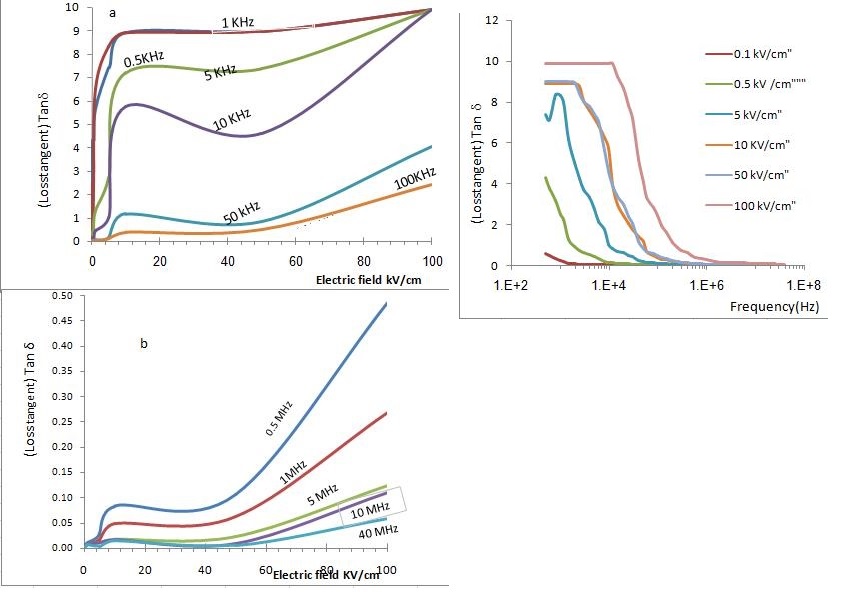
Figure 4-a, b. Variation in loss tangent (tan δ)of modified LDPE grade LA071 samples under varying electric fields (kVcm-1) at different frequencies.
Figure 4-c. Frequency variation of loss tangent (tan δ) for modified LDPE grade LA071 samples under different electric fields.
FIGURE 5
Figure 5: Power law fit cable loss data for modified LDPE grade LA071 samples under different electric fields.
FIGURE 6
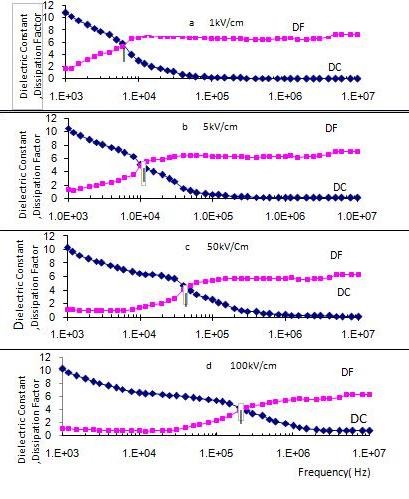
Figure 6: Frequency variation with dielectric constant DC and dissipation factor DF values for modified LDPE grade LA071 samples under different electric fields.
FIGURE 7
Figure 7: Magnification of the megahertz insulation region in Figure 6.
FIGURE 8
Figure 8:Variationin a.c. conductivity with the frequency of modified LDPE grade LA071 samples under different electric fields. The continuous solid line in the σ spectra represents the fit of the experimental data to the power law .
FIGURE 9
Figure 9:Dependence of a.c. the conductivity of LDPE grade LA071 under various electric fields at different frequencies= (103 Hz and 104Hz).
Figures at a glance