Glycaemic Indices of Etsew (A Corn-Based Food) With Different Fermentation Periods
Received Date: May 28, 2020 Accepted Date:June 23, 2020 Published Date:June 26, 2020
doi: 10.17303/jfn.2020.6.202
Citation:Jennifer Eyram Nkrow (2020) Glycaemic Indices of Etsew (A Corn-Based Food) With Different Fermentation Periods. J Food Nutr 6:1-7.
Abstract
Three corn-based foods from the same corn species obatampaa produced at different fermentation periods (one day, three days, and five days) were investigated for glycemic indices (GI). Proximate analysis was determined using the standard method. The research design was a cross-over trial. Ten healthy subjects consisting of five males and five females were used for the study. The study subjects were served 50g of glucose-containing 50g of available carbohydrate and 200ml of pure water. Glucose which served as the reference food was given to subjects on two different occasions. The subjects were also served specific 50g of Etsew made from different fermented days. Etsew when eaten by the study participants yielded low glycemic indices of 8% for the one-day fermented dough Etsew, 10% for the three-days fermented dough Etsew and 8% for the fivedays fermented dough Etsew. There was no statistically significant difference at (p< 0.005) between GIs of the Etsew indicating fermentation time has no significant effect on GI. Etsew was observed to have a low glycaemic index. It can, therefore, be highly recommended for diabetics.
Keywords:Glycaemic index; Glucose; Etsew; IAUC; Fermentation
Introduction
Corn, a good source of carbohydrate, is the main energy source in most human diets. It makes up about 40-80% of our calorie intake and plays an important role in human physiology [12]. Most Ghanaian diets are usually carbohydrate-based (a good number of these foods are made from corn) and most families plan their meals around it. Dough made from corn is particularly important for weaning foods such as Koko for infants and as dietary staples for adults. People from various parts of Ghana have their shared traditional foods made of corn dough. The tribes from the Northern parts of Ghana use it for TuoZafi, the Gãs use it for kenkey, The Fantes for Fante kenkey, the Ewes use it for Amorkple, etc. These foods have become common Ghanaian dishes which are served on all occasions.
The energy content and digestibility of different carbohydrates however differ [12]. Some carbohydrate foods prompt a quicker response from insulin than others [10]. This may be due to differences in the rate at which these foods release glucose into the blood after they are consumed. The relative ranking of how fast or slow a carbohydrate food is converted to glucose after ingestion is a measure of its glycaemic index [8].
The incidence and prevalence of diabetes are dramatically increasing globally and reflect current lifestyle trends which are often characterized by the intake of high caloric foods coupled with low physical activity. According to the World Health Organization (2012), type 2 diabetes, also known as Non-Insulin Dependent Diabetes (NIDD) is the leading cause of cardiovascular diseases with a global prevalence of 10%. The incidence of type 2 Diabetes mellitus (T2DM) does not only influence an individual's health but also causes an economic loss to society as a result of increased health-care costs.
A joint FAO/WHO Expert consultation report stresses the need to determine the GI of local staples locally due to differences that could arise from various cooking and processing methods [1].
The glycaemic index (GI), though a simple numerical index that measures the blood glucose’s rising ability of carbohydrates, has become an established concept for classifying carbohydrates [6]. In determining the glycaemic index of carbohydrate food, the postprandial (after meal) glycaemic response of the food is measured against a reference food [6]. The glycaemic index value is also directly influenced when the physiological effect of carbohydrate is changed [2]. Several factors influence the postprandial glycaemic response of carbohydrates when ingested. Such factors are particle size, processing methods, nature of starch, and anti-nutritive factors present in food which are often absent in food tables yet have very significant effects on the physiological properties of food [1].
The GI of food is ranked on a scale of 0 to 100 with zero being the food with the lowest GI and 100 being the food with the highest GI. Based on the GI values, there are three major categories of carbohydrates. Foods with GI in the ranges of 0 – 55, 56 – 69, and 70 – 100 are considered low, medium, and high GI foods respectively. Processing, preparation, and cooking methods have been found to influence the glycaemic index of food [1]. However, as to whether GI would increase or decrease, it will depend on the type of processing that food is taken through.
Corn is processed through many stages before the final product Etsew is produced. It is speculated that processing can affect the G.I. values of foods. Fermentation is a major processing step in most corn-based foods and Etsew in particular. This study aims to determine the glycaemic indices of Etsew made from the same corn species obatampaa with varying fermentation periods.
Methodology
Proximate Determination
Proximate analysis was carried out on the three samples of corn dough and the three samples of Etsew. The proximate analysis of samples for moisture content, crude protein, ash, and crude fibre was carried out on the acceptable products developed using the standard methods described by AOAC, (2002). Crude fat was extracted using the Soxhlet procedure with petroleum ether (60-80o C) by AOAC, (2002). Carbohydrate content was determined by difference.
Determination of Moisture content
Analytical balance (AD HR-250AZ) was used to weigh 10g of the samples into the cleaned crucible. The samples were oven-dried at a temperature of 105 o C for 48 hours. The samples were then removed from the oven and immediately put in a desiccator to cool for 30 minutes. The dry weights of the samples were determined after cooling. The percentage of moisture content of the samples was determined using the formula below
Moisture content (%) = (weight of fresh sample-weight of oven-dry sample (g))/(weight of oven-dry sample(g))
Determination of Ash Content
Approximately 0.2 g of the fermented corn dough and Etsew samples were weighed into a pre-weighed empty crucible. The crucibles containing the sample were placed in the oven at 100o C for 24 hours. The crucibles were removed from the oven and then transferred to a furnace where the temperature was raised to 550o C. The temperature was maintained for 8 hours until white ash was obtained. The crucible was then removed from the furnace directly into a desiccator and allowed to cool for 30 mins and weighed. The percentage of ash content of the sample was calculated using the formula below:
Ash content (%) = (Ash weight )/(Oven-dry weight) x 100
Determination of Protein
Nitrogen was determined by AOAC Kjeldahl method 979.09 using a nitrogen auto-analyzer (Foss Electric, Denmark). The percentage of nitrogen in the samples tested was calculated using the formula below:
% N = ((S-B) x M x 14.007)/(weight of sample (mg)) x 100 x100/20
The protein content was calculated using the formula: % protein = % N x 6.25, where 6.25 is the protein-nitrogen conversion factor and the N is nitrogen.
Determination of Fats and Oil
Lipid content was determined by the AOAC Goldfish Method No. 945.16 and total carbohydrate and fiber calculated by difference.
Glycaemic Determination
Following the approval of the Institutional Review Board of the University of Cape Coast (UCCIRB), 10 apparently healthy persons comprising five males and five females were purposely selected and recruited for the clinical trial. Purposive sampling was used because the study focused on non-diabetic patients. [13] explained that purposive sampling is a form of non-probability sampling in which decisions concerning the individuals to be included in the sample are taken by the researcher, based upon a variety of criteria which may include respondents’ specialist knowledge of the research issue, or capacity and willingness to participate in the research. The 10-sample size recruited was in line with the [6] recommended method for the determination of the Glycaemic Index. Health status information was obtained by asking candidates about current and past treatment for gastrointestinal disorders and diabetes mellitus. This was done with the help of a medical practitioner from the Cape Coast Regional Hospital. The individuals’ Diabetes status was also confirmed from their fasting blood sugar. Their fasting blood sugar was in the ranges of 3.9-6.1mmol/L. This shows that participants who took part in the test were not prediabetes or diabetic. Participants were asked to list any current medications taken for such diseases. Pregnancy, breastfeeding, and possible allergies to food items were also investigated. Candidates were excluded if they reported a history of gastrointestinal disorders, Diabetes mellitus metabolic disorder, or any cardiovascular diseases (CVD), and if they were currently pregnant or breastfeeding. These exclusions were made to avoid any complications that may arise from the consumption of the test foods. Health status assessment was based on self-report rather than objective tests.
All participants were brought together a week before the start date of the experiment and given orientation. Participants were informed of the importance of adhering to the rules of engagement in the research. Participants were informed of strict abstinence from smoking or drinking within the period of the study. They were also advised to avoid engaging in any strenuous activity prior to the testing days. [11] report that acute physical exercise can increase muscle glucose.
A self-developed screening form was used to collect data from the participants for the glycaemic test. The screening form was in two parts. The first part consisted of items that sought data on participants’ demographic profile information such as age and gender and the anthropometric profiles of the body. Weight (kg) and height (m) of participants sampled for the study were measured using a bathroom weighing scale and meter rule respectively. Body mass index (BMI) was calculated using the formula BMI = weight/height2 . Additionally, information on the last meal eaten the previous night, and time the meal was eaten were provided. These were all open-ended questions. Each form was allocated with defined codes for each participant for identification. `
The second part was a table that was used to record the sugar concentration in mmol/L every 30min after the consumption of both the test food and reference food for 2 hours.
In determining the glycaemic index, the fermented dough made for 1 day, 3 days, and 5 days were used to prepare Etsew, a corn-based food. All participants were made to undergo a 10 to 14 hour fast from the time of taking their last meal of the previous night to the morning of testing. This was to ensure that complete metabolism takes place so that the food consumed previously will not interfere with the test. All participants reported to the premises of the Food and Nutrition Laboratory in the VOTEC Department between 7:00 - 8:30 am. The reporting time and venue were the same for both reference and test foods. The individuals on reporting were weighed without shoes on using a weighing scale. The heights of participants were all measured in an upright position with a meter rule. The participants were asked about their previous meal eaten and the time that it was taken before their fasting blood sugar was determined. This was recorded on the self-prepared data collection sheet. Each individual was assigned an identification number that was used throughout the test period as well as for the data entry and analysis.
Data Analysis
The incremental area under the curve (IAUC) was calculated for each food in every participant separately (as the sum of the surface of triangles and trapezoids between the blood glucose curve and horizontal baseline going parallel to x-axis from the beginning of blood glucose curve at time 0 to the point at time 120 min) to reflect the total rise in blood glucose response after administering the test foods. When a blood glucose value falls below the baseline, only the area above the fasting level is included. In each participant, the GI (%) was calculated by dividing the incremental area under the curve for the tested food by the incremental area under the curve for the standard glucose and multiplying by 100. The formulae used was [5].
The Glycaemic Index (GI) of food will be: GI = ((IAUC) 50g carbohydrate of test food)/((IAUC) 50g carbohydrate of reference food) × 100
The GI value of food then is the mean of 10 participants of the percentage expression in everyone. All the values of blood glucose and glycaemic index were expressed as mean ± standard error (Mean± SE). The values were analyzed by one-way analysis of variance (ANOVA). A value of P < 0.05 was evidence for a statistically significant difference.
Results and Discussion
General Characteristics of Subjects
The ten healthy males and females that were selected for the study have a mean age of 26.2±3.0 years (range: 23 – 33), mean body mass index (BMI) of 22.1±2.1 Kg/m2 (range: 21 – 25) and mean Waist Circumference (WC) 76.2±8.5 cm (range: 61 – 90). The BMI and the Waist circumference ranges revealed that the respondents selected for the study were neither underweight nor overweight.
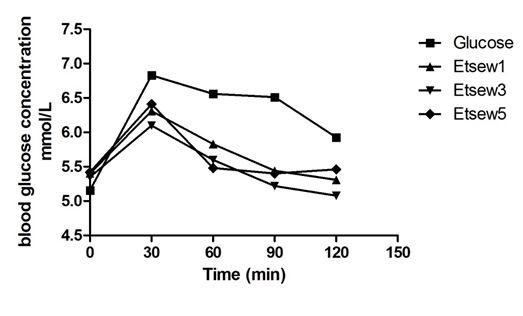
The average fasting blood glucose levels before the consumption of the various test foods and reference food were almost similar in (Figure 1) and they were within 5.0 – 5.5 mmol/L. This implies that the respondents’ bodies maintained a fairly constant normal blood sugar level even after an overnight fast. This shows that the blood sugar levels of participants fell within the normal range of healthy individuals. The average peak of glucose in all participants after consumption of test food was observed from the 30th minutes of the ingestion of food as was observed with the pure glucose solution. This means that the blood glucose level after administering the reference food and test foods rose from time 0 and reached a glycaemic peak value at 30mins and dropped slowly until it reached a minimum value at 120thmins. However, the oral glucose caused the rapid and thus very high increase in the glycaemic response of the participants before it started decreasing at the 30th min. This could indicate the complete absorption of glucose in a short time. Nonetheless, the test foods showed a gradual but steady increase in the glycaemic response of the volunteers throughout the whole exercise.
The GI Values of the Test Foods
From the results in (Table 1), it can be seen that the Oral Glucose Tolerance Test (OGTT) showed a high mean value of 285.91 whereas Etsew 1, Etsew 3, and Etsew 5 recorded a lower mean value of 46.70, 38.22 and 43.12, respectively. This expresses the area under the curve of each of the 10 individuals who consumed the 50g glucose solution and 50g of each test food. This shows the rate at which the glucose is being digested by each participant, that is, throughout the entire study time, the body of the individuals absorbed the glucose solution at a faster rate, hence the high mean value. The low mean values in the test foods could imply that the three test foods underwent digestion at a lower rate.
The results in (Table 2) can be seen that the measured GI of the corn-based food made from three different fermentation periods and their classes have their minimum and maximum values at a 95% confidence interval. This means that there is a 95% confidence that the GI value of the tested foods are in the minimum and maximum range of values stated. The glycaemic index of the test foods was found to be low (≤ 55). This is evident from the results in (Table 2) with a mean and standard error value as M = 10; SE = 2, M = 8; SE = 3 and M = 10; SE = 2 for the day 1 Etsew, day 3 Etsewand day 5 Etsew respectively.
These findings of the test foods could be attributed to the fact that the preparation of Etsew made from corn dough fermented for different days might have resulted in the production of organic acids that are produced as by-products of the fermentation. This finding is in harmony with that of [15] who indicated that acetic acid is considered part of the normal diet and forms during sourdough fermentation. In addition, [14] reported that there is an improvement in glycaemic control in fermented starch foods [9] emphasized that acetic acid influences glycaemic response and even suggested the inclusion of fermented foods in meals to improve glycaemic control. They further confirmed that acetic acids reduced glycaemic response by delaying gasteric emptying. The finding of the current study is in consonance with that of [7] who found that fermentation periods reduce glycaemic index. However, the responses of the foods in his study showed a positive correlation with periods of fermentation in the food whereas the current study showed a fluctuation in the GI of the three test foods. This could be attributed to the fact that the test foods differ in the two studies.
A cursory look at proximate nutritional composition of Etsew in (Table 3) revealed that increased fat lowers GI in foods and vice versa. For instance, the fat content of the day 3 Etsewwas1.28% with a GI value of 8 whilst the fat content of the day 5 Etsew was 1.26% with GI of 10. This justifies the assertion of [4] that fat increases the time it takes for food to leave the stomach and enter the intestine. By slowing the rate that carbohydrates are digested in the intestine, fat-containing foods may temper the rise in blood glucose and yield a lower GI than similar foods without fat. The day 3Etsew having the least GI was not surprising considering that it had a lower available carbohydrate portion per 100g in (Table 2) compared to day 5Etsew.
The fibre content of 100g of the corn dough made from day 1, day 3, and day 5 was 1.6%, 1.9%, and 2.0% respectively in (Table 3). However, the fibre content increased when the dough was processed into Etsew. This was represented with a mean value of 2.1%, 2.1%, and 2.3% for day 1 Etsew, day 3 Etsew, and day 5 Etsew respectively. The low GI of the test foods could be attributed to the presence of a high amount of fibre. Comparing the fibre contents, there is a noticeable difference before and after processing into various dishes. This explains the findings of [1] that processing obviously affects the total fibre content.
Most of the participants complained of a nauseating feeling after the consumption of glucose solution which was the reference food. This could probably be due to the high concentration of sugar in the glucose which was taken on an empty stomach. The participants’ response was as [5] indicated when they studied the use of white bread and glucose as a reference food in the determination of GI. Despite the observed effect, glucose happens to be the reference food of choice because of possible variations that could result in the preparation of white bread in different research areas [3].
Conclusion
The glycaemic responses of the three test foods prepared from1 day, 3days and 5days fermented dough which shows 8%,10% and 8% GI respectively were not statistically different and as well below the standard 55% response rate for low response. The outcome of this research shows that diabetics can comfortably eat Etsew without any fears of increased blood glucose.
- Aston LM, Gambell JM, Lee, DM, Bryant SP, Jebb SA (2008) Determination of the glycaemic index of various staple carbohydrate-rich foods in the UK diet. European Journal of Clinical Nutrition 62: 279–285.
- Bahado-Singh PS, Riley CK, Wheatly AO, Lowe HI (2011) Relationship between the processing method and the glycaemic indices of ten sweet potatoes (ipomoea batatas) cultivars commonly consumed in Jamaica. Journal of Nutrition and Metabolism 5: 2-6.
- Bornet FR, Costagliola D, Blayo A, et al. (1987) Insulinogenic and glycaemic indexes of six starch-rich foods taken alone and in a mixed meal by type 2 diabetics. American Journal of Clinical Nutrition 45: 588 - 95
- Brand-Miller J, Hayne S, Petocz P, Colaguiri S (2003) Low–glycaemic index diets in the management of diabetes. Diabetes Care 28: 2261-2267.
- Brouns F, Bjorck I, Frayn KN, Gibbs A L, Lang V & Slama G (2005) Glycaemic Index methodology. Nutrition Research Review 18: 145 - 71.
- FAO/WHO (1998) Carbohydrates in human nutrition. Report of a Joint FAO/WHO expert consultation. Rome: FAO Food and Nutrition Press.
- Ihediohanma NC (2011) Determination of the glycaemic indices of three different cassava granules (garri) and the effect of fermentation period on their glycaemic responses. Pakistan Journal of Nutrition 10: 6-9.
- Lavigne C, Marrette A, Jaques H (2000) Cod and soy proteins compared with casein improve glucose tolerance and insulin sensitivity in rats. American Journal of Physiological Endocrinol Metabolism 278: 491-500.
- Liljeberg H & Bjorck I (1998) The delayed gastric emptying rate may explain improved glycaemia. European Journal of Clinical Nutrition 52: 368-371.
- Lin MH A, Wu MC, Lu S, Lin J (2010) Glycaemic index, glycaemic load, and insulinemic index of Chinese starchy foods. World Journal of Gastroenterol 16: 4973-4979.
- Malkova D, Evans RD, Frayn KN, Humphreys SM, Jones PRM, Hardman AE (2000) Prior exercise and postprandial substrate extraction across the human leg. American Journal of Physiology-Endocrinology and Metabolism 279: E1020–E1028.
- Mann J, Cummings JH, Englyst HN, Key T, Liu S, Riccardi G, Summerbell C (2007) FAO/WHO Scientific Update on carbohydrates in Human nutrition: Conclusions. European Journal of Clinical Nutrition 61: S132 - S137.
- Oliver P (2006) Purposive sampling. The SAGE dictionary social research methods. London: SAGE Publication.
- Ostman EM, Elmstahl HG, & Bjorck IM (2001) Inconsistency between glycaemic and insulinemic responses to regular and fermented milk products. American Journal of Clinical Nutrition 74: 96-100.
- Ostman E, Granfeldt Y, Persson L & Bjorck I (2005) Vinegar supplementation lowers glucose and insulin responses and increases satiety after a bread meal in healthy subjects. European Journal of Clinical Nutrition 59: 983–988.
- World Health Organization (2012) World Health Statistics. Geneva: World Health Organization Press.
FIGURE 1
Figure 1:Mean Glycaemic responses elicited by study participants after consumption of 50g available carbohydrates portions of three test foods and reference food.
Figures at a glance