Examination of the Physiological Status of the Human Cardiovascular System In Vivo Through Skin Color Variations
Received Date: February 23, 2019 Accepted Date: March 26, 2020 Published Date: March 28, 2020
doi: 10.17303/jber.2020.4.102
Citation:Jung Y. Huang (2020) Examination of the Physiological Status of the Human Cardiovascular System In Vivo Through Skin Color Variations. J Biomed Eng 4: 1-13.
Abstract
We developed a sensitive color sensor module to examine the physiological status of the human cardiovascular system. The module displays breathing rhythm and heartbeat activity in real-time. The skin lightness and skin color expressed in the CIELAB color coordinate system fluctuate according to the rhythm of breathing and the heartbeat because of changes in the relative concentrations of oxygenated and deoxygenated hemoglobin species and the blood volume pulse (BVP) in the skin tissue. Using a Gaussian mixture model, the cardiovascular system was found to fall into three physiological states. The state distribution profiles deduced from skin color variation differed before and after physical exercise. The distributions were also different between young adults with different physical exercise habits. Our result showed that regular exercise can reduce the heartbeat rate (HR) while increasing the BVP for each heartbeat. Compared with young people, elderly people exhibited increased HR with reduced BVP owing to the reduced efficiency of their aged cardiovascular system. Our results suggest that skin color variation may be a useful indicator of self-health management.
Keywords: skin color; photoplethysmography; heartbeat rate; blood volume pulse; principal component analysis; Gaussian mixture model; hidden Markov model.
Introduction
The skin is the largest organ in the human body due to its largest surface area. It is responsible for isolating internal organs from external pollution and germs and serves as the body’s first line of defense against external threats [1]. It also prevents water evaporation and heat loss from the body. In addition, it can provide the first indication of the state of our physiological system. Based on an understanding of the skin’s functional properties, diagnostic techniques have been developed to acquire pathological information. For example, practitioners of traditional Chinese medicine (TCM) have long used the skin appearance observation technique to acquire pathological information on a patient [2]. Furthermore, skin cupping is a popular physical therapy used by TCM practitioners [3]; it involves the production of partial vacuum effects on the skin and its associated muscle layers to increase the metabolism and detoxification capabilities of the body [3]. This therapeutic technique can treat a variety of headaches [4]. As the skin can reflect the symptoms of some diseases, observation of changes in skin appearance, particularly skin color, has attracted considerable interest from biomedical researchers. Indeed, physicians often use skin color as the first indication of jaundice [5] and methemoglobinemia [6]. It is generally believed that a rosy complexion indicates good health [7]. Ruddy skin represents greater blood perfusion and higher blood oxygen saturation in the skin tissue [8]. Pale skin is often associated with anemia caused by a lack of hemoglobin. Blood perfusion can improve with physical exercise [9], and it commonly decreases in diabetes [10] or hypertension [11, 12]. Increased blood oxygen saturation indicates a high degree of aerobic fitness. Coronary heart disease and respiratory diseases tend to reduce blood oxygen saturation, leading to hypoxia [12] and cyanosis [13]. In recent years, with a rise in health awareness, the concept of self-health management has attracted increasing attention from physicians for its possible preventive effect against modern lifestyle diseases [14]. Self-health management can reduce the occurrence of chronic diseases and consequently the number of and need for medical treatments and hospitalization [15]. Ensuring the accessibility of non-invasive instruments, especially those that can be operated with non-medical personnel, is crucial to realize the potential of self-health management. Examples of such instruments include infrared thermal imaging [16] or thermal sensing materials [17] to monitor skin temperature changes, or iontophoresis to monitor skin glucose concentrations to control diabetes [18]. Plethysmography (PG) is a technique that detects the cardiovascular pulse waves traveling through the human body. Photo-plethysmography (PPG) uses optical reflectance to implement PG [19, 20]. As blood exhibits greater light absorbance than its surrounding tissue, variations in the blood volume can be reflected by changes in light reflectance. A smaller blood volume in skin tissue generates greater optical reflectance and a higher PPG signal [21]. Non-contact PPG has been demonstrated in some studies [22–24] using low-cost video cameras [22]. However, most previous PPG studies have focused on demonstrating the functionality of this technique, leaving certain critical issues understudied. For example, is the physiological status of the human cardiovascular system appropriately described in a state space [25]? Can the relevant states be described using the heartbeat rate (HR) and blood volume pulse (BVP)? What are the unique features of these states? To answer these questions, we designed and fabricated a handheld color sensor module to examine the physiological status of the human body in vivo [26]. Compared with imaging technology, our color sensor module has greater sensitivity and a higher signal-to-noise (S/N) ratio. It can record both slow and rapid color changes in the skin. The measured color variation amplitudes provide a clean waveform of breathing and heartbeat rhythm in real-time, yielding valuable HR and BVP data for each heartbeat. In this study, we verified that color variations in the heartbeat rhythm stem from the BVP, whereas those in the breathing cycles reflect changes in the relative concentrations of oxygenated and deoxygenated hemoglobin species in the blood volume of the skin. The probability distributions of physiological states reflected by the skin color changes were retrieved using Gaussian mixture models (GMMs) that revealed different distributions before and after physical exercise. The distributions deduced from the skin color variation also differed between young adults with different physical exercise habits. The results indicate that regular exercise could reduce HR while increasing BVP for each heartbeat. Compared with young people, elderly people exhibit increased HR with reduced BVP per heartbeat owing to the reduced efficiency of their aged cardiovascular system. Our results suggest that skin color variation may be a useful indicator of self-health management using a portable color sensor.
Experimental Procedure
Electronics and light-collection optics of the color sensor module
The color sensor module includes a light-collection section to efficiently acquire the diffuse reflectance signal from the region of interest (ROI) and can deliver at least 54 lux to the sensor’s active area [26]. Of the received power, the signal from the ROI only decreases from 100% to 60% when the target-to-sensor distance increases from 4 cm to 10 cm, displaying a satisfactory differentiation ability for the ROI.
The diffuse reflectance signal is detected using an RGB color sensor (Hamamatsu S9032) [27] that can deliver a photocurrent of 9–20 nA at the RGB channels under 50 lux illuminance. A low-noise electronic circuit is designed and assembled to convert the photocurrent into voltage. The circuit can be divided into a current-to-voltage converter, a preamplifier, and AC and DC output stages. The AC channel provides a gain of 200 in a passband of 0.1–28 Hz, aiming to provide statistical information on the heartbeat. The DC channel amplifies the signal by 2 in a passband of 0–1.6 Hz and is designed to reveal color variations in the low-frequency region. The noise level in the passband at the AC output is less than -60 dB and can be lower than -100 dB to -120 dB at the DC output [26]. The measured gain profiles closely match the simulated curves, indicating that this circuit can amplify the color signals with an acceptable S/N ratio for this study.
The color sensor module can provide six voltage signals at the AC and DC outputs. The electrical signals are converted to digital signals by a 24-Bit Delta-Sigma AD converter (Texas Instruments ADS124S06) [28] and stored in a computer or displayed in real-time. Typically, the sensor module is operated with a 100-Hz data acquisition cycle. Each cycle involves six cascading 1.6-ms AD conversions, which add up to a data conversion period of 9.6 ms.
Color calibration procedure for the color sensor module
To measure color variation for physiological status monitoring, the module needs to be calibrated to produce accurate color coordinates of the skin. This can be achieved using the voltage values at the DC output, which are denoted as VDC = (Vr Vg Vb)T. Note that the voltage at the i = R, G, B channel is related to the photocurrent Ii by Vi = AiIi with Ai reflecting the action of electronic amplification and frequency filter. The photocurrent is generated by an incident light S(λ) via Ii =∫S(λ). Fi(λ)dλ through a color filter Fi(λ). The resultant color coordinates (R G B) of the incident light S(λ) can be determined as follows:

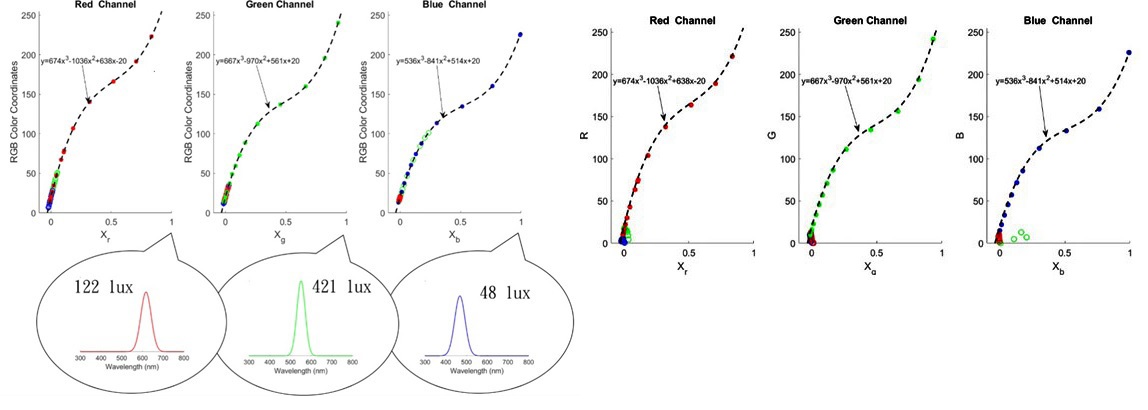
where r0 g0 b0 denotes the bias values in the RGB channels, and C is the calibration matrix to be determined. The off-diagonal elements of C originate from the finite spectral width of the R (G or B) light used [see the inset in (Figure 1 a)], which has non-zero overlap with the passbands of the color filters. For example, the red light centered at 630 nm can leak through the green color filter (60-nm bandwidth centered at 530 nm), yielding a non-zero Cgr at the green channel.
To determine each element of the C matrix, we project the R (G or B) color light of a projector onto a standard white surface. The diffuse reflectance is measured with our color sensor. The voltage changes ΔVr at r channel with varying illumination intensities are normalized Xr = ΔVr/ΔVr, max with the maximum voltage change ΔVr, max at an Illuminance of 122 lux, which has a color coordinate of R=255, G=0, and B=0. This procedure is repeated for the g- and b-channels using the green and blue color outputs of the projector. As shown in Figure 1(a), the color coordinates used can fit a third-order polynomial of the measured values Xr, Xg and Xb, respectively. The values of Crr, Cgg, and Cbb can thereby be determined. The r-channel photodiode is responsive not only to the red light but also to the green and blue light. However, the photocurrents generated at the r-channel photodiode by the green and blue light encounter the same electronic circuit and therefore shall follow the same responsive curve as that produced by the red light. These data are displayed as the green and blue symbols on the left-hand side of the plot in (Figure 1a). The responses of the r-channel photodiode to the green and blue light provide the information needed to determine Cgr and Cbr. This is also true for the g- and b-channel photodiodes, whose responses can be used to determine Crg, Cbg and Crb, Cgb. The resultant calibration matrix for our color sensor module becomes
After the calibration, the much lower coupling can be achieved with our color sensor as displayed in (Figure 1b). The direct readout values on a set of color cards agree well with known color coordinates, indicating that the color coordinates of the skin can be read accurately by our color sensor without the need to detrend and invert the data [21].
Physiological implication of skin color variations
Breathing and heartbeat induced skin color variations
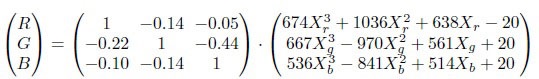
Short segments of the DC signal (0–1.6 Hz) measured at the palm of a healthy 26-year-old Asian male are shown in (Figure 2 a). The color variations are caused by breathing-induced absorption differences between the arterial blood and bloodless skin layers. The RGB color coordinates fluctuate at the skin tone (R = 153, G = 117, and B = 107) of this test subject. The amplitude of breathing-induced color variation is approximately 1. Small ripples visible on the breathing signal envelopes are attributable to heartbeats. We apply principal component analysis (PCA) to determine the breathing-induced color variation vectors. (Figure 2 b) shows the first three PCA traces after removing the skin tone. The resulting principal component 1 (PC1), comprising 0.78 red, 0.33 green and –0.11 blue, closely follows the red and green signals and accounts for approximately 95% of the breathing-induced color variation, whereas PC2, which closely follows the blue signal, accounts for approximately 4.9% of the color changes.
Although distinctive breathing-induced color variations are visible in (Figure 2a), these variations may originate from changes in lightness or colors. To resolve this ambiguity, we convert the measured RGB coordinates into the CIELAB color system [29], which comprises lightness L*, the red/green opposing colors a*, and the yellow/blue opposing colors b*. A change from a red color to green yields negative a* values, whereas that from a green color to red yields positive a* values. A similar trend is also found for b* in the yellow/blue opposing colors. (Figure 2c) presents the relevant results for the breathing-induced color variations. Unlike the RGB coordinates, L*a*b* reveals similar time-varying profiles. (Figure 2d) shows the first three PCA traces of the signals. The PC1, which accounts for approximately 93.5% of the breathing-induced color variation, is comprised of 0.42 L*, 0.05 a*, and 0.53 b*, indicating that most of the color changes occur at the yellow/blue opposing colors. We conclude that breathing increases the concentration of oxygenated hemoglobin species in the arterial blood and the increased absorption contrast in skin tissue results in the distinctive color changes in the yellow/blue region. Skin colors also carry BVP information [21]. To reveal this information, we present the color signals from the AC channel (0.1–28 Hz) in (Figure 3a). The observed RGB color signals fluctuate with an amplitude of approximately 0.2. We apply PCA to determine the heartbeat-in induced color variation vectors. (Figure 3b) shows the first three PCA traces of the RGB signals. PC1 (black solid curve), comprising 0.73 red, 0.2 green, and 0.07 blue, accounts for approximately 89% of the heartbeat-induced color variation, whereas PC2 (red solid curve) accounts for 10% of the color variation.
Figure 3c presents the results for the heartbeat-induced color variations in the L*a*b* coordinate system. We find that most of the signal variations in RGB are caused by lightness changes. The variation in a* closely follows the variation in L*. This similarity is understandable, as BVP driven by the cardiovascular system can result in both lightness and red/ green color variations. At the peaks of L*, a* becomes more positive (i.e., redder). This observation agrees with the video recording result obtained using the Eulerian video magnification algorithm [30, 31]. The yellow/blue color variations along the b* axis are somewhat irregular, suggesting that the physiological process that causes yellow/blue skin color variations may differ from heartbeat-induced BVP. The corresponding PCA traces are shown in (Figure 3d). PC1, which is comprised of 0.37 L*, 0.53 a*, and 0.1 b*, accounts for approximately 72% of the color variation, whereas PC2 accounts for 27% of the color variation.
To further investigate the nature of the heartbeat-induced color variation, both the AC color signals and the electrocardiographic (ECG) signal are displayed in (Figure 4a). ECG, which monitors the voltage changes caused by each heartbeat, provides a convenient timing reference. A good correlation is observed between the color signals and the ECG. A Fourier transform of the RGB signals is presented in (Figure 4b), showing a peak at 1.2 Hz that clearly stems from the heartbeat rhythm.
We convert the measured RGB color coordinates to the CIELAB color system [29] and display the L*a*b* traces in (Figure 4c). As illustrated in (Figure 3c), the variation in a* closely follows the variation in L*, which is also supported by the Fourier transform of L* and a* signals shown in (Figure 4d). The heartbeat rhythm at 1.2 Hz disappears in the Fourier transform of b*, accompanied by the appearance of breathing feature at 0.5 Hz. Based on the results presented in ( Figures 3 and 4), we conclude that most of the signal variations at heartbeat rhythm are attributable to changes in lightness and red/green opposing colors, originating from heartbeat-induced BVP. Whereas the b* color changes at 0.5 Hz is caused by breathing-induced concentration increases of oxygenated hemoglobin species in the arterial blood. Skin color signals reveal detailed information on the cardiorespiratory activity.
Description of the physiological states of the human cardiovascular system with skin color coordinates
Localizing the peaks (tj)j=1,.,N displayed in Fig. 4 and retrieving their peak amplitudes (aj)j=1,.,N are straightforward processes. From (tj)j=1,.,N , the heartbeat periods (Δtj = tj+1 − tj)j=1,.,N −1 can also be deduced. The color variation amplitudes (aj)j=1,.,N and heartbeat periods (Δtj) j=1,., N of 120-min-long PC1 signals from both the AC and DC channels are determined and used to label the physiological states embedded in the RGB color signal. The data are fitted to GMMs [32] with different numbers of Gaussian components. The corresponding Bayesian information criterion [32] index is calculated and the results indicate that using a three-component GMM is the best way to address the fitting errors and the overfitting problem in this context.
The probability distribution of the physiological states of the human cardiovascular system at rest and after exercise
The PC1 sequence of RGB data from the DC channel was collected over 6 days (1 hr each day), resulting in about 2,160 breathing cycles. The resultant distribution of the physiological states on the plane of aj and Δtj is shown on the left-hand side of (Figure 5). The breathing period in the state S1 highlighted in red is centered at 10 s, whereas those in the two other states are longer (S3: blue) or shorter (S2: green). The S2 state exhibits a breathing period of about half of that exhibited by the S1 state and shows weaker color variations. In contrast, compared with the S1 state, the S3 state represents deep breathing with a larger amplitude of color variation, and possibly more oxygen dissolved in the arterial blood.
To investigate how the physiological states respond to physical exercise, we apply the color sensor to the same subject after physical exercise. The plot on the right-hand side of (Figure 5) shows the distribution of aj and Δtj. It shows that the breathing period of the three states is reduced by a factor of 2 and is accompanied by weaker color variations, correlating with less oxygen dissolved in the arterial blood per breathing cycle.
sequence of RGB data is also acquired from the AC channel and fitted to the GMM. The distribution of aj and Δtj from 29,000 heartbeats is presented in (Figure 6). Different amplitudes of color variation are observed for the three states. The S3 (blue) state stems from a rarer heartbeat activity, whose period is widely distributed and reveals the smallest color variation. The S2 (green) state has a heartbeat period of 0.75 s, which is similar to that of the S1 (red) state (0.7 s) but has a wider Δtj distribution. The Δtj distribution appears to be more tightly regulated in the S1 state than in the other two states.
We can combine the data from the DC and AC channels to identify the differences in the distribution of heartbeat states during inhaling and exhaling periods. However, after careful analysis, we find no difference in the GMM distributions of the heartbeats, indicating that in this healthy young subject, the BVP from heartbeats may be tightly regulated [33] and shows no difference between inhaling and exhaling. However, we notice that immediately after physical exercise, the peaks of the S1 and S2 state distributions shift down to Δtj = 0.53 s, correlating with increased cardiovascular output. The S2 state also exhibits a narrower distribution profile along Δtj and a weaker variation in aj. Interestingly, the S3 state is more widely distributed on aj. The data suggest that in response to exercise the cardiovascular system makes the heartbeat periods of the S1 and S2 states shorter and skewed toward the S3 state to increase the oxygen supply to the body. The relaxation process of the cardiovascular system after physical exercise can be resolved by dividing a 120-minlong color sequence into a series of 5-min-long segments. As only a limited number of heartbeats are included in each interval, we can only use a Gaussian distribution profile to fit aj and Δtj. As a reference, the cardiovascular system at rest is first characterized before physical exercise. The contours of the resultant Gaussian distribution are presented in black. The Gaussian distribution profiles extracted from each interval are coded from red to green. As shown in (Figure 7), immediately after physical exercise, the Gaussian distribution evolves from a vertical ellipse (red) to a near circle and then to a horizontal ellipse (green). Notably, from the observed shape evolution, the relaxation appears to evolve from S1 (red) to S2 (green) and then S3 (blue) in (Figure 6). In addition, the Gaussian distribution does not relax to the profile at rest even after 120-min of relaxation, suggesting that physical exercise may be able to exert a long-term effect on the cardiovascular system.
Transition kinetics of the physiological states of the human cardiovascular system at rest
GMM can provide information on the distributions of physiological states, but cannot yield relevant time-domain information. Some critical questions remain unanswered. For example, does the cardiovascular system switch rapidly between the three states or be trapped in one or two states, only rarely making state transitions? To deduce such time-domain information from our measurements, we fit PC1 traces of the AC channel to a Gaussian hidden Markov model [33]. To perform the analysis, the model parameters, which include initial population probabilities for each hidden state, the transition probabilities, and the means and covariance matrix of the Gaussian emission probabilities are first prepared. We take the results of the GMM analysis and randomly generate a transition probability matrix as the initial model parameters. We then refine these model parameters using the expectation- maximization algorithm. Finally, by using the refined model parameters a forward-backward algorithm is applied to predict the hidden state sequence with the observed PC1 data sequence as an input. The predicted probability distributions of the hidden state population are presented in (Figure 8a). The highest probability values of the heartbeat period are found to be 0.7 s for S1 and 0.75 s for S2. S1 has a larger color variation amplitude than S2, whereas S3 exhibits the lowest color variation across a wide heartbeat period. The black line offers a convenient projection of the data points, yielding histograms of inline distances for each state in (Figure 8b). In (Figure 8c), the inline distances of 4,000 data sequences are plotted against the times of occurrence to reveal the transition kinetics. As shown, the cardiovascular system does not switch rapidly between S1 and S2 states but is trapped in S1 or S2 states and does a state transition occasionally. The hidden state transition kinetics collected from a 360-min-long sequence are summarized in (Figure 8d).
Our GMM and HMM results can be best illustrated by viewing the human cardiovascular system as a periodically driven dynamical system and describe the resulting physiological status in state-space representation. The main purpose of the state space model is to present an abstract concept of the actual dynamical processes of the cardiovascular system. Because many physiological parameters and conscious/subconscious factors can affect the physiological states, the cardiovascular system will behave stochastically, implying the physiological states can only be depicted with a probability distribution.
The data shown above suggest that the stochastic dynamics of the cardiovascular system can be described in a statespace span by (aj) and (Δtj), where the feature of (Δtj) can reflect the stochasticity of heartbeat periodicity and (aj) will expose the system responses, such as BVP, in terms of color coordinates. From HMM analysis, we found that the occupation probabilities of S1 (green), S2 (red), and S3 (blue) are 0.32, 0.46, and 0.22, respectively. The unique features of these states suggest that the cardiovascular system appears to reside in the S1 or S2 states for most of the time, occasionally transitioning to S3. Although a robust biological system is usually tightly regulated, it may still possess the flexibility needed to adapt and survive in different physiological conditions. Thus, we reason that the latter state may provide the cardiovascular system with the freedom it needs to adapt to conditions that demand a rapid increase in cardiovascular output.
Distribution of physiological states in different health conditions
After showing that skin color can be used to reveal physiological conditions, we further study whether the color sensor can reveal the effect of physical exercise on physiological states. To reduce the complexity of our study, we include exercise habit as the sole experimental factor among three 26-year-old healthy Asian male participants of the same age. Subject A had a habit of exercising daily, subject B only exercised 1-2 times per week irregularly, and subject C did not have a habit of exercising. Each subject rested on a chair for 5 minutes before measurement. A time series of L*a*b* color coordinates is collected and fits a Gaussian distribution profile. The resultant distribution contours are displayed in (Figure 9) with black (subject A), red (subject B) and blue (subject C). The figure shows that subject A exhibits a strong beat-to-beat variation in a* and longer heartbeat periods, whereas subject C shows a weaker beat-to-beat variation and shorter heartbeat periods. A larger a* variation indicates a stronger red-to-green color change per heartbeat and therefore implies a larger BVP and a faster metabolic speed. Indeed, Levy, et al found that exercise training can increase parasympathetic tone and thus reduces the heartbeat rate at rest in both older and young groups [34]. Our result agrees with Levy’s conclusion but from a different perspective, indicating different health conditions of participants at the same age can be distinguished by their heartbeat-induced skin color variations.
Distribution of the physiological states at different ages
Our next study focuses on whether the distribution of skin color can deduce whether the physiological states are different at different ages. We measure the heartbeat-induced skin color changes in two volunteers. Volunteer A is a healthy 26-yearold Asian male with a daily exercise habit, and volunteer B is a 65-year-old Asian male without a habit of exercise. As shown in (Figure 10), the younger volunteer (black) with regular exercise exhibits a stronger variation in the a* color coordinate and a lower HR than those of the elderly volunteer (pink). Stein et al reported that HRs are significantly higher among older men than among younger men because both sympathetic and parasympathetic modulation reduces with age [35]. Furthermore, according to Strandell’s study, the amount of blood output by heartbeat also decreases as the cardiovascular system ages [36]. Our findings presented in (Figure 10) support the notion that skin color variation may be a useful indicator of the physiological status of the human cardiovascular system.
The portable color sensor module could be a useful device for self-health management. For further development, it will be of high value to expand the RGB channels to the near-infrared region in viewing that crucial bio-active species in bloodstream such as fat and proteins exhibit absorption from 1000 nm to 1500 nm. It is expected that changes in local concentrations of these species can result in skin color changes and is detectable with the color sensor module. Acquiring such data per heartbeat or breathing cycle could offer valuable dynamical information on the cardiorespiratory activity. Furthermore, as shown in [26], the relative delay time of the heartbeat-induced skin color signal to that of ECG was found to vary with measurement positions on the body, reflecting the cardiovascular pulse wave propagation delay from a neighboring artery to the measurement site. Following the idea of pulse transient time measurements with ECG [37, 38], continuous monitoring of blood pressure with a color sensor module may be possible.
Conclusion
In summary, we developed a skin color sensing technique to monitor the physiological status of the human cardiovascular system. This handheld portable module can reveal both breathing and heartbeat rhythms in real-time. In the CIELAB color coordinate system, the skin color changes caused by breathing are mainly indicated by the L* and b* variations, reflecting the changes in the relative concentrations of oxygenated and deoxygenated hemoglobin species in the skin, whereas the heartbeat-induced color changes are indicated by the variations in L* and a* coordinates, mainly caused by the BVP in the skin.
The stochastic behavior of the cardiovascular system can be described in the state space span by the features of (Δtj) and (aj) extracted from the heartbeat-induced color changes. Detailed probability distributions of the physiological states were retrieved using the GMM, showing different distribution profiles in the state space before and after physical exercise. The unique features in the probability distributions of three major states (S1, S2, and S3) suggest that the cardiovascular system at rest appears to reside in the S1 or S2 states for most of the time, occasionally transitioning to S3. The distributions were also found to differ between young adults with different physical exercise habits. Our results show that regular exercise can reduce HR while increasing BVP. Compared with young people, elderly people exhibited increased HR with reduced BVP owing to the reduced efficiency of their aged cardiovascular system. Our study indicates that the portable color sensor can be a useful device for self-health management.
Acknowledgment
This research is funded by the Ministry of Science and Technology of the Republic of China (grant number MOST 106-2112-M-009-019-MY3).
- AM Scholz, L Bunger, J Kongsro, U Baulain, and AD Mitchell (2015) “Non-invasive methods for the determination of body and carcass composition in livestock: dual-energy x-ray absorptiometry, computed tomography, magnetic resonance imaging, and ultrasound: invited review,” Animal 9: 1250–1264.
- C Zhao, GZ Li, CJ Wang, and JL Niu (2015) “Advances inpatient classification for traditional Chinese medicine: A machine learning perspective,” Evid. Based Complement. Alternat. Med. 376716–376718.
- SS Yoo and F Tausk (2004) “Cupping: east meets west,” Int. J. Dermatol. 43: 664–668.
- A Ahmadi, D Schwebel, and M Rezaei (2008) “The efficacy of wet-cupping in the treatment of tension and migraine headache,” Am. J. Chin. Med 36: 37–44.
- TM Buttaro, J Trybulski, P Polgar-Bailey, and J Sandberg- Cook (2012) Primary Care: A Collaborative Practice (Elsevier Health Sciences 690–694.
- J Ashurst and M Wasson (2011) “Methemoglobinemia: a systematic review of the pathophysiology, detection, and treatment,” Del Med J. 83: 203–208.
- ID Stephen, ML Smith, MR Stirrat, and DI Perrett (2009) “Facial skin coloration affects perceived health of human faces,” Int. J. Primatol. 30: 845–857.
- ID Stephen, V Coetzee, ML Smith and DI Perrett (2009) “Skin blood perfusion and oxygenation color affect perceived human health,” PLoS ONE 4: e5083–5087.
- JM Johnson (1998) “Physical training and the control of skin blood flow,” Med Sci Sports Exerc. 30: 382–386.
- B Fromy, P Abraham, C Bouvet, B Bouhanick, P Fressinaud, and JL Saumet (2002) “Early decrease of skin blood flow in response to locally applied pressure in diabetic subjects,” Diabetes 51: 1214–1217.
- MS Rendell, BK Milliken, EJ Banset, M Finnegan, C Stanosheck and JV Terando (1996) “The effect of chronic hypertension on skin blood flow,” J Hypertens. 14: 609–614.
- AS Cowburn, D Macias, C Summers, E R Chilvers, and RS Johnson (2017) “Cardiovascular adaptation to hypoxia and the role of peripheral resistance,” eLife 6: e28755–23.
- MS McMullen and W Patrick (2013) “Cyanosis,” Am. J. Med. 126: 210–212.
- MJ Rotheram-Borus, BL Ingram, D Swendeman and A Lee (2012) “Adoption of self-management interventions for prevention and care,” Prim Care 39: 649–660.
- F Shaffer, R McCraty, and C L Zerr (1999) “Evidence suggesting that a chronic disease self-management program can improve health status while reducing hospitalization: a randomized trial,” Med. Care 37: 5–14.
- C Barbosa Pereira, M Czaplik, V Blazek, S Leonhardt, and D Teichmann (2018) “Monitoring of cardiorespiratory signals using thermal imaging: A pilot study on healthy human subjects,” Sensors 18: 1541–1518.
- J Yang, D Wei, L Tang, X Song, W Luo, J Chu, T Gao, et al. (2015) “Wearable temperature sensor based on graphene nanowalls,” RSC Advances 5: 25609–25618.
- B Leboulanger, RH Guy, and M B Delgado-Charro (2004) “Reverse iontophoresis for non-invasive transdermal monitoring,” Physiol. Meas 25: R35–R50.
- AB Hertzman and CR Spealman (1937) “Observations on the finger volume pulse recorded photoelectrically,” Am. J. Physiol.119: 334–335.
- J Allen (2007) “Photoplethysmography and its application in clinical physiological measurement,” Physiol. Meas. 28: R1–39.
- AA Kamshilin and NB Margaryants (2017) “Origin of the photoplethysmographic waveform at a green light,” Physics Procedia 86: 72–80
- W Verkruysse, LO Svaasand, and JS Nelson (2008) “Remote plethysmographic imaging using ambient light,” Opt. Express 16: 21434–21445.
- MZ Poh, DJ McDuff, and RW Picard (2011) “Advancements in noncontact, multiparameter physiological measurements using a webcam,” IEEE Trans. Biomed. Eng. 58: 7–11.
- G de Haan and V Jeanne (2013) “Robust pulse rate from chrominance-based rppg,” IEEE Trans. Biomed. Eng. 60: 2878– 2886.
- KP Murphy (2012) Machine Learning: A Probabilistic Perspective (Chap. 18) (The MIT Press, Cambridge, Massachusetts 631–660.
- JY Huang and CY Hsu (2019) “Developing a handheld color sensor module to monitor the physiological status of the human cardiovascular system in vivo,”, 1–16, 1–16, An eBook on Biomedical Engineering (https://openaccessebooks.com/biomedical- engineering.html , Open Access eBooks, 848 N. Rainbow Blvd, #5486, Las Vegas, NV 89107, USA).
- Hamamatsu (2019) “RGB color sensor,” https://www. hamamatsu.com/resources/pdf/ssd/s9032-02_kspd1067e.pdf
- Texas Instruments (2019) “Delta-Sigma ADC,”https:// www.ti.com/product/ADS124S06
- WikiPedia (2019) “CIELAB color space,” https:// en.wikipedia.org/wiki/CIELAB_color_space
- HY Wu, M Rubinstein, E Shih, JV Guttag, F Durand, and WT Freeman (2012) “Eulerian video magnification for revealing subtle changes in the world,” ACM Trans. Graph 31: a65.
- N Wadhwa, HY Wu, A Davis, M Rubinstein, E Shih, et al. (2017) “Eulerian video magnification and analysis,” Comm of ACM 60: 87–95.
- T Huang, H Peng, and K Zhang (2017) “Model selection for gaussian mixture models,” Statistica Sinica 27: 147–169.
- S Paris (2019) “EM for HMM multivariate Gaussian processes,”.
- WC Levy, MD Cerqueira, GD Harp, KA Johannessen, et al. (1998)“Effect of endurance exercise training on heart rate variability at rest in healthy young and older men,” Am. J. Cardiol 82: 1236–1241.
- PK Stein, RE Kleiger, and JN Rottman (1997) “Differing effects of age on heart rate variability in men and women,” Am. J. Cardiol. 80: 302–305.
- T Strandell (1976) Cardiac output in old age. in Cardiology in Old Age (Eds: F.T. Caird, J.L.C. Doll, and R.D. Kennedy) (Plenum Press, New York, 81–100.
- X Ding, BP Yan, YT Zhang, J Liu, Zhao, and HK Tsang (2017) “Pulse transit time based continuous cuffless blood pressure estimation: A new extension and a comprehensive evaluation,” Sci. Rep. 7: 11554–11.
- A Esmaili, M Kachuee, and M Shabany (2017) “Nonlinear cuff-less blood pressure estimation of healthy subjects using pulse transit time and arrival time,” IEEE Trans. Instrum. Meas. 66: 3299–3308.
FIGURE 1
Figure 1:(Color online) Color calibration of the color sensor module. (a) Normalized sensor output at the i-channel photodiode Xi = Vi=Vi;- max (i=r, g, and b) as a function of the RGB color coordinates of i-color light from a digital projector. The green and blue symbols at the r-channel photodiode (left) represent the data measured with this photodiode under green and blue light illumination, respectively. The dashed curves are the third-order polynomial fit of the color coordinates to the measured data Xi. The insets at the middle section show the spectral profiles of the red (R=255), green (G=255), and blue (B=255) light used, which yield Vi;max. (b) Post-calibration output at the i-channel photodide. The cross-talk in the calibrated data is closer to zero than that in (a).
FIGURE 2
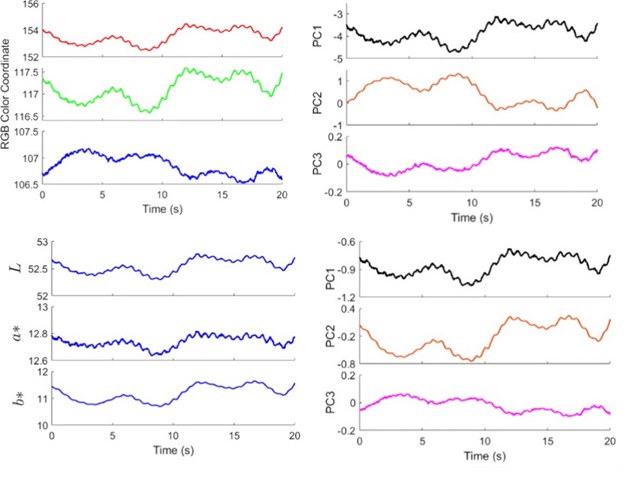
Figure 2:(Color online) Breathing-induced color coordinate variations. (a) RGB color coordinates (at the palm of a healthy 26-year-old Asian male) determined from the DC output channel (0�1.6 Hz) of the color sensor module. Small ripples visible on the breathing signal envelopes are attributable to heartbeats. (b) Corresponding PCA outputs of the RGB traces shown in (a) by removing the skin tone (R = 153, G = 117, and B = 107). (c) CIELAB color coordinate traces are relevant to (a) comprising lightness L*, the red/green opposing colors a*, and the yellow/blue opposing colors b*. (d) Corresponding PCA outputs of the L*a*b* traces shown in (c).
FIGURE 3
Figure 3: (Color online) Heartbeat-induced color coordinate variations. (a) RGB color coordinates at the palm of a healthy 26-year-old Asian male retrieved from the AC channel output (0.1�28 Hz) of the color sensor module. (b) First three PCA components of RGB traces shown in (a). (c) CIELAB color coordinate traces relevant to (a), comprising lightness L*, the red/green opposing colors a*, and the yellow/blue opposing colors b*. (d) First three PCA components of (c).
FIGURE 4
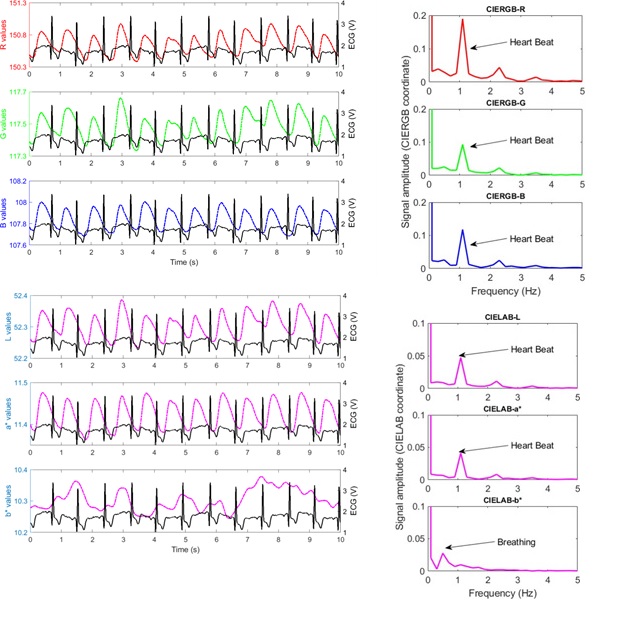
Figure 4:Fast Fourier transform plot of heartbeat-induced color coordinate variations. (a) Measured RGB signals (R: top, G: middle, B: bottom) at the AC output of the color sensor module measured at the palm of a healthy 26-year-old Asian male. ECG traces (black) are plotted as the timing reference. (b) Fourier transform of the measured AC signals shown in (a). (c) RGB signal traces shown in (a) are expressed in the L*a*b* color coordinates (L*: top, a*: middle, b*: bottom). (d) Fourier transform of the L*a*b* color coordinate signals shown in (c).
FIGURE 5
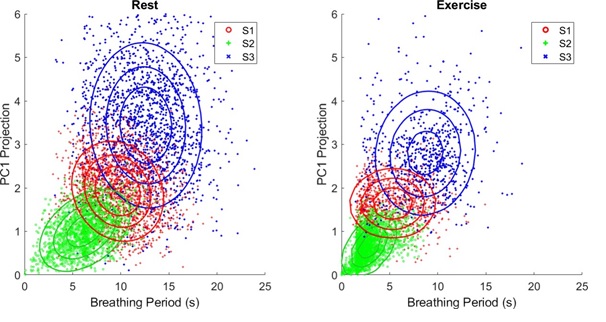
Figure 5: Gaussian mixture model fitting of breathing-induced color variation data. A 120-min PC1 signal trace from the DC output (0.1�28 Hz) of the color sensor module is fitted to the GMM of three states (S1 coded by red, S2 by green, and S3 by blue). The color signals are measured at the palm of a subject at rest (left) and after physical exercise (right).
FIGURE 6
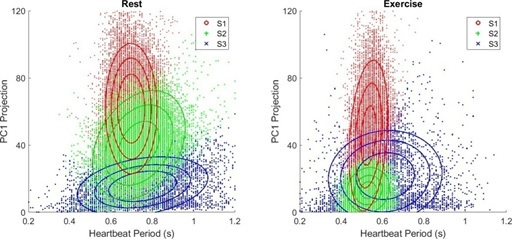
Figure 6: Gaussian mixture model fitting of heartbeat-induced color variation data. A 120-min PC1 signal trace at heartbeat rhythm from the AC output of the color sensor module is fitted to the GMM of three states (S1 coded by red, S2 by green, and S3 by blue). The color signals are measured at the palm of a subject at rest (left) and after physical exercise (right).
FIGURE 7
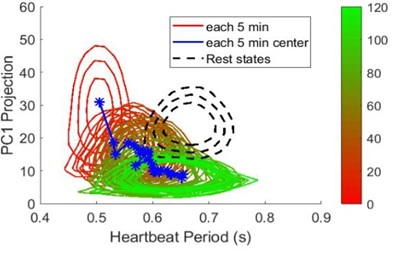
Figure 7: Relaxation trajectory of heartbeat-induced color variation after physical exercise. A 120-min-long PC1 sequence is divided into a series of 5-min-long segments. aj and ?tj extracted from each interval are fitted to a Gaussian distribution profile and the resultant contours are coded from red to green. Relaxation trajectory is displayed by connecting the centers (blue star symbols) of each contour profile with lines. The Gaussian distribution profile at rest is characterized before physical exercise and is presented in black.
FIGURE 8
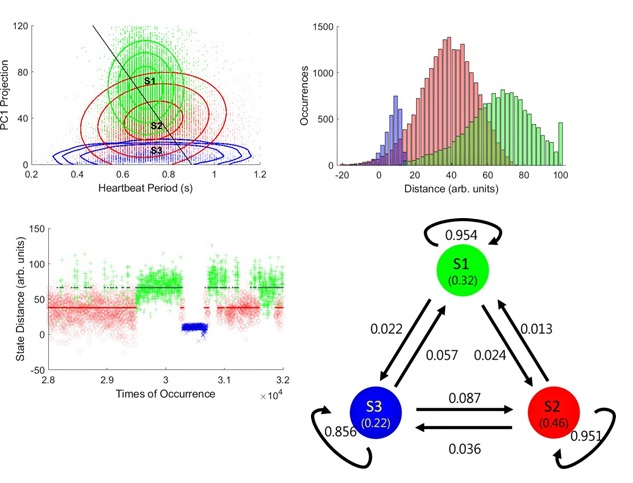
Figure 8: Hidden Markov model fitting of heartbeat-induced color variation data. (a) A 360-min PC1 signal trace taken from the AC output of the color sensor module is fitted to the hidden Markov model with three hidden states (S1 coded as green, S2 as red, and S3 as blue). The black line is a projection of the data points. (b) Histograms of the three hidden states along the black projection line. (c) The inline distances of 4,000 data sequences are plotted against the times of occurrence to reveal the transition kinetics. (d) The hidden state transition diagram collected from a 360-min-long sequence. This figure has been revised from ref. [26] to make the discussion of this paper more complete.
FIGURE 9
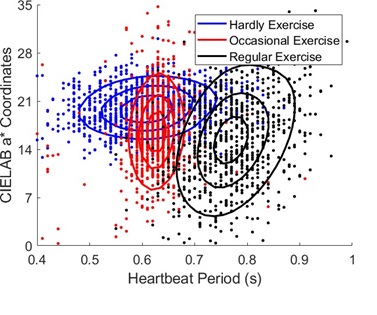
Figure 9: Physiological states for different health conditions. Gaussian distribution profile of 30-min heartbeat-induced color variations (expressed in the L*a*b* coordinate system) in 26-year-old healthy Asian males: one with a habit of daily physical exercise (black), one with a habit of irregular exercise (red), and one with a habit of no exercise (blue).
FIGURE 10
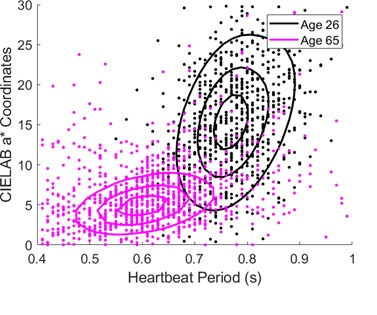
Figure 10: Physiological states for different ages. Gaussian distribution profile of 30-min heartbeat-induced color variations in a 26-year-old (black) and a 65-year-old (pink) Asian male.
Figures at a glance